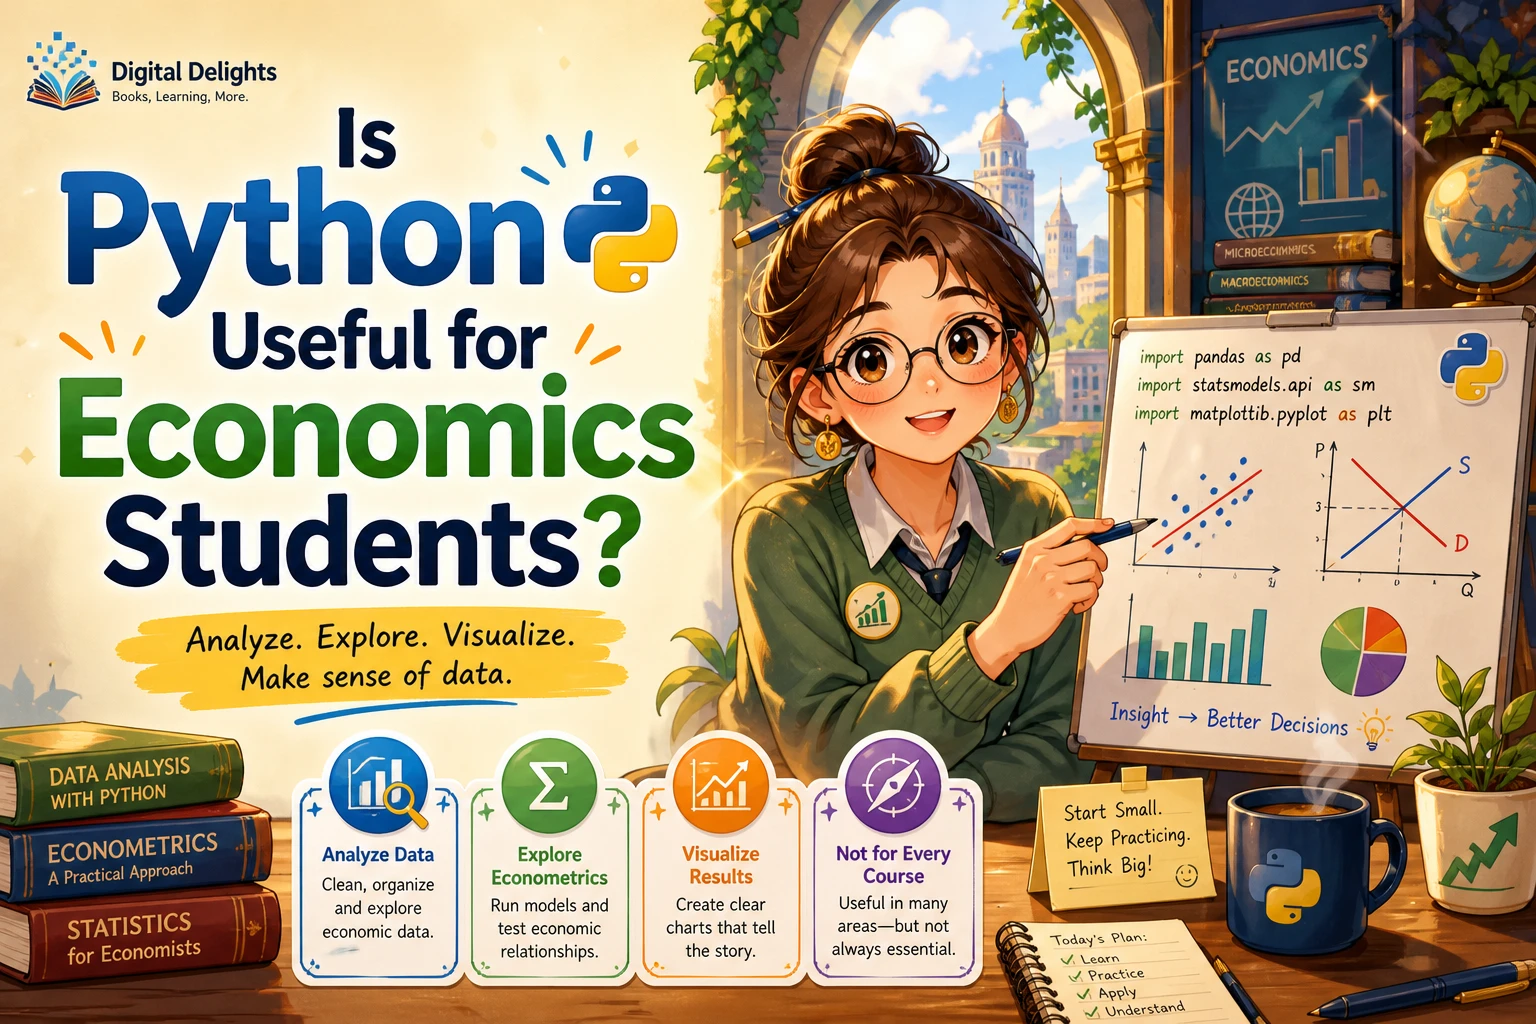
Is Python Useful for Economics Students?
Yes—Python can be useful for economics students, particularly when they need to work with data, explore econometric methods, make visualizations, or build computational projects. But it is not essential for every economics course, and learning it should not take priority over a tool your instructor or workplace specifically requires.
Python can help you carry out calculations and organize analysis; it cannot supply economic theory, sound research design, or judgment about what results mean. This guide explains where it fits, how it compares with other tools, and a practical way to start without treating programming as a goal in itself.
What can Python help economics students do?
Economics questions often involve data: how an indicator changes over time, whether variables move together, or how an estimated model behaves. Python provides a way to write repeatable steps for tasks like these. Examples in publisher descriptions include Python-based teaching of econometric methods and data analysis, financial analysis using economic indicators, and computational economics models. Those examples establish that the language is used in these areas; they do not prove it is required or best for every student.
- Prepare and explore data: read datasets, check values, summarize variables, and identify missing or unusual observations.
- Analyze relationships: calculate descriptive statistics and fit statistical or regression models, when appropriate to your course and research question.
- Visualize results: create charts that make patterns, changes, and comparisons easier to inspect.
- Make analysis repeatable: save a sequence of data-cleaning and analysis steps so you can rerun or revise them systematically.
- Explore applied topics: use code in areas such as financial analysis or computational economics when those subjects form part of your studies.
A Springer textbook on econometrics describes using Python to teach econometric methods and data analysis, including pandas for data handling, Matplotlib for visualization, and Statsmodels for statistical and regression work (Springer’s econometrics textbook description). A separate Springer finance book describes examples involving economic indicators, market data, statistical analysis, and risk models (Applied Quantitative Finance).
What Python cannot replace
Python is a tool for expressing procedures and working with information. It does not decide whether a dataset measures the concept you care about, whether a model’s assumptions make sense, or whether an observed association supports a causal conclusion. Those are questions of economics, statistics, and research design.
Nor should you assume that Python replaces the software required by a course. Instructors may provide code, assignments, or lab instructions built around another tool. Ask what environment your course expects before spending time setting up a different one. A computational economics textbook published in 2011, for example, focused on MATLAB, Maple, and Excel rather than Python—one reminder that computational work in economics has used multiple tools (Foundations of Mathematical and Computational Economics).
Python compared with R, Stata, MATLAB, and spreadsheets
There is no universal winner for economics students. The right choice depends on your course requirements, the task, and what you need to share or reproduce. This table is a broad orientation, not a ranking or a claim that one program is superior.
| Tool | Useful way to think about it | What to check first |
|---|---|---|
| Python | A programming language used for data workflows, analysis, visualization, and wider computational projects. | Whether your course supports it and which packages or environment it uses. |
| R | A programming option used for statistical analysis and data visualization. | Whether your instructor provides R materials or expects a particular package or workflow. |
| Stata | A statistical software environment you may encounter in applied empirical coursework or research. | Whether it is specified in course instructions, labs, or research workflows. |
| MATLAB | A numerical-computing environment that may be used in quantitative or computational courses. | Whether your department supplies it or course materials depend on it. |
| Spreadsheets | A familiar way to inspect and organize modest tables or perform straightforward calculations. | Whether the task needs a more documented, repeatable analysis workflow. |
If your class uses Stata, MATLAB, or another program, learn enough of that tool to complete the required work. Python can be a useful additional skill, but learning two environments at once may add unnecessary friction. If you are choosing independently, start with the question you want to answer and the methods you need—not with claims that a particular language is always the best choice.
A practical learning path for Python for economics students
You do not need to master every part of Python before applying it to economics. Build a foundation, then learn the data and analysis steps that support a small, well-defined question.
- Learn basic programming. Practice variables, data types, conditional statements, loops, functions, and reading error messages. The official Python tutorial introduces core language concepts and is a general programming resource, not an economics course.
- Work with tabular data. Learn how to load a file, inspect its rows and columns, select variables, handle missing values, and calculate simple summaries. The specific library or setup may depend on your course.
- Make clear visualizations. Create a line chart for a time series or a scatterplot for two variables. Label axes and units so the chart can be interpreted rather than merely viewed.
- Connect code to methods you already study. Reproduce a descriptive statistic or a simple regression from class, then check that you can explain the result in economic terms.
- Complete a small project. Choose one question, document your data and steps, and explain the limits of what your analysis can show.
For a fundamentals-first resource, The Practice of Computing Using Python covers programming concepts such as control structures, data structures, functions, file handling, and exercises. If you are more interested in working with datasets, Python for Data Science: A Hands-On Introduction covers data structures, data access, databases, and data-science workflows. These are programming and data resources, not substitutes for economics or econometrics instruction.
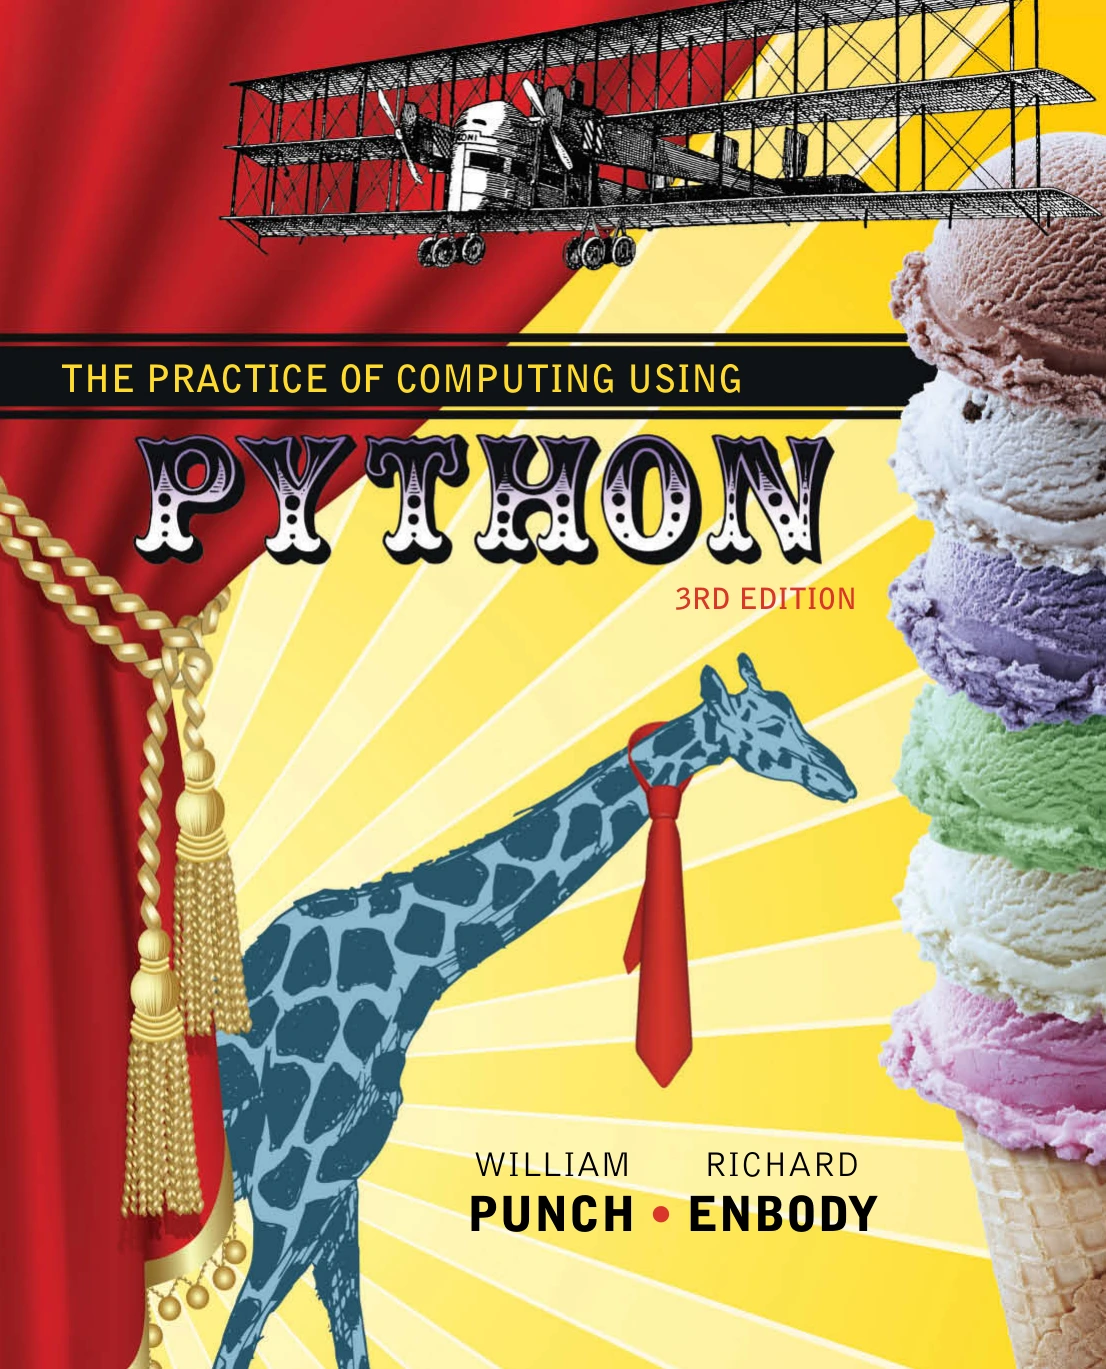
The Practice of Computing Using Python
Students who want a structured introduction to Python concepts such as control structures, data structures, functions, and file handling.
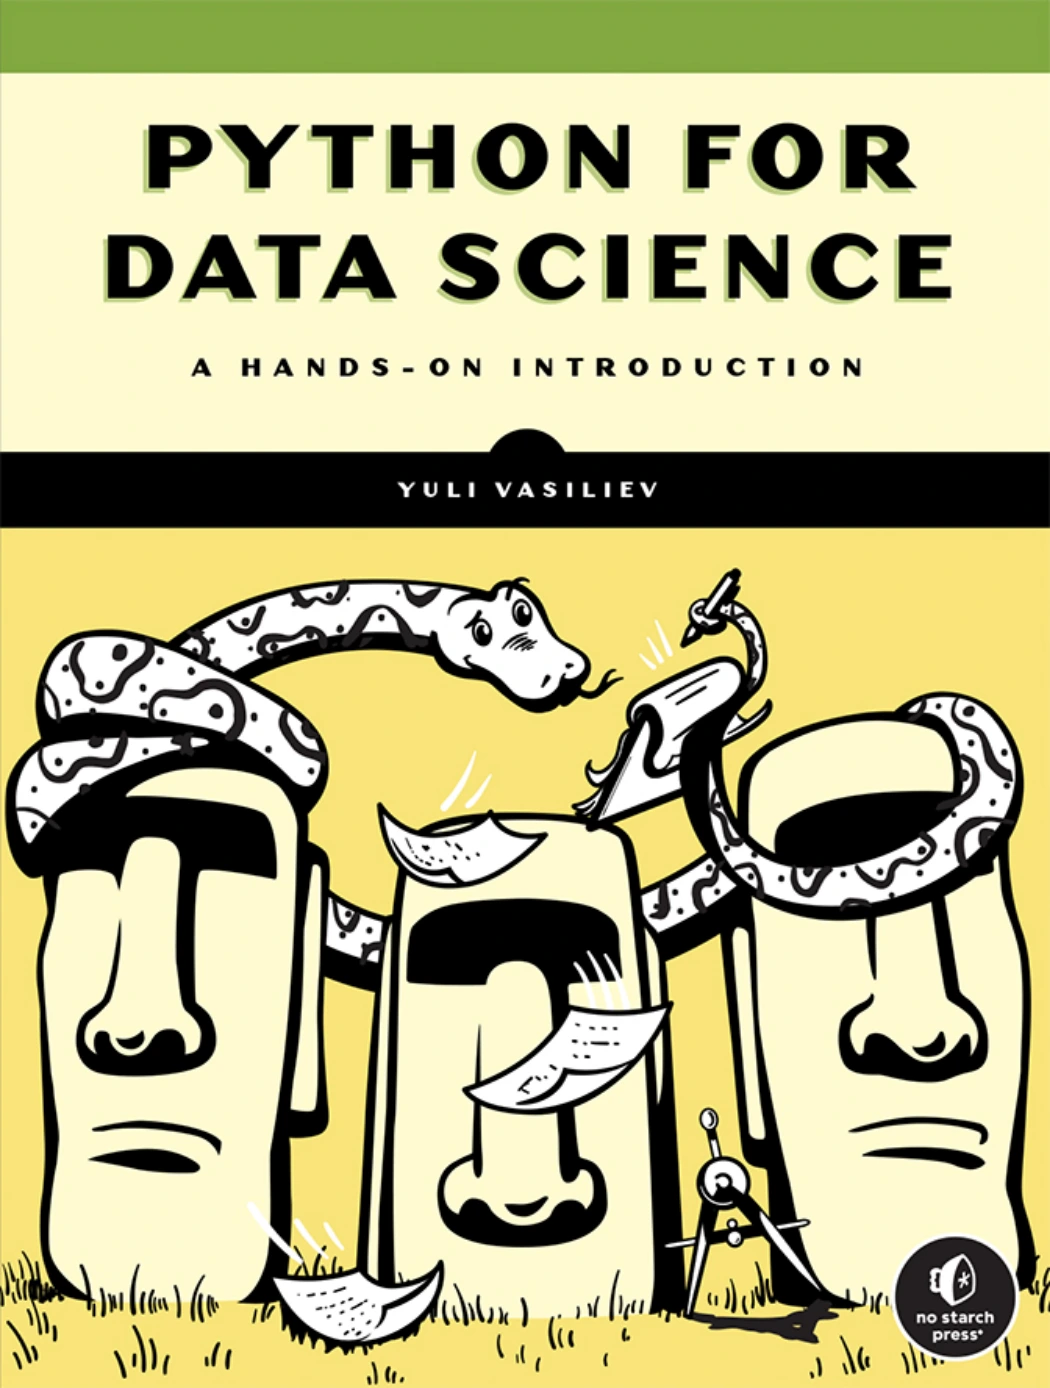
Python for Data Science: A Hands-On Introduction
Learners interested in Python data structures, data access, databases, and working with datasets.
For students who want statistical concepts and Python examples together, Modern Statistics: A Computer-Based Approach with Python covers topics including descriptive statistics, probability, inference, regression, sampling, and time series. It is a statistics-focused textbook, so consider whether its scope matches your current background and course.
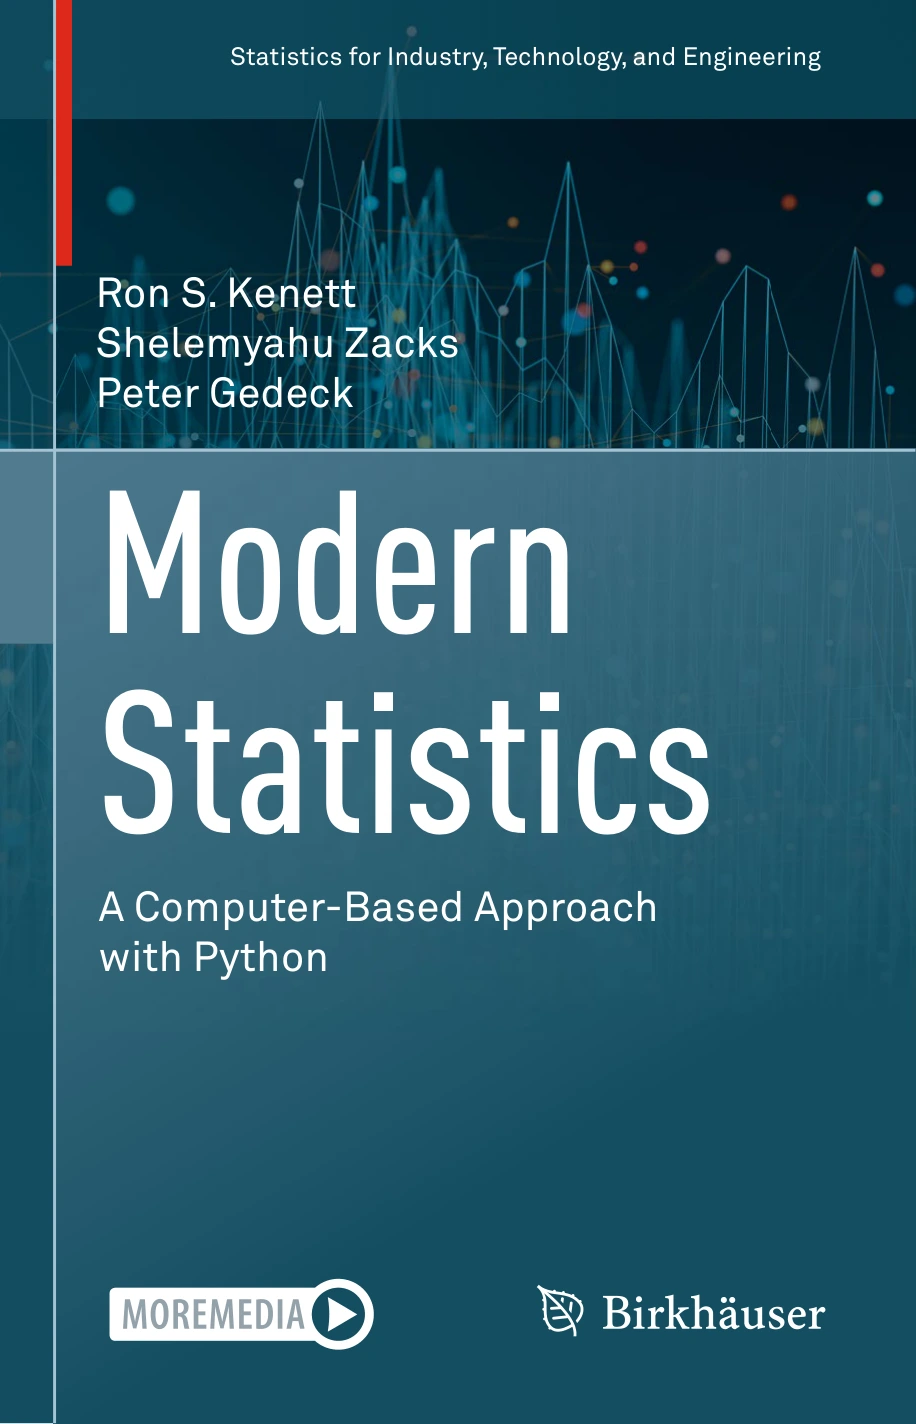
Modern Statistics: A Computer-Based Approach with Python
Students seeking a statistics-focused resource covering topics such as inference, regression, sampling, and time series.
Students exploring financial applications may also consider Python for Finance: Mastering Data-Driven Finance, Second Edition. Its catalog description covers financial data, time series, numerical methods, simulation, and risk analysis; it is aimed at finance-oriented work rather than serving as a general introduction to economics.
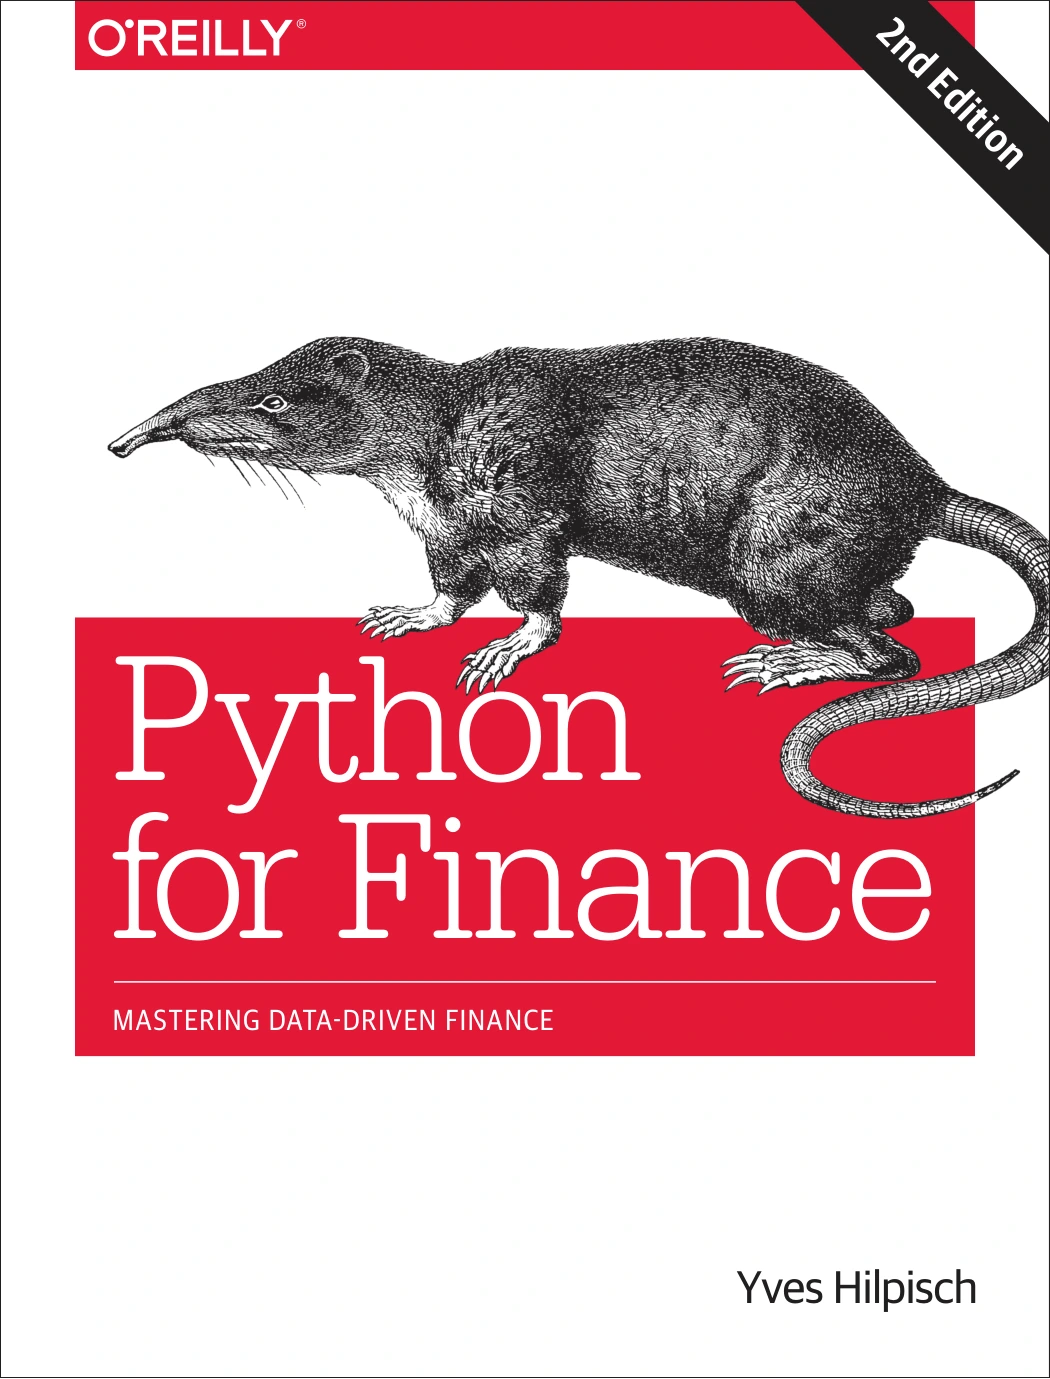
Python for Finance: Mastering Data-Driven Finance, Second Edition
Readers interested in financial data, time series, numerical methods, simulation, or risk analysis.
Beginner project ideas with an economics angle
Choose a project small enough to finish and explain. Use data that is available to you, check its definitions and dates, and be explicit about what the analysis cannot establish.
- Plot an economic indicator over time. Make a line chart, note changes in units or frequency, and describe visible patterns without assuming what caused them.
- Summarize a public dataset. Choose a few relevant variables, calculate basic summaries, and explain who or what each observation represents.
- Visualize a relationship between two variables. Use a scatterplot and describe the association. A correlation or visible pattern alone does not demonstrate that one variable causes the other.
- Reproduce a class exercise. Recreate one table or chart from your course and compare your output with the expected result. This checks both your code and your understanding of the method.
Keep a short record of the data source, any cleaning choices, and the steps you took. That makes it easier for you—or a classmate or instructor—to follow how you reached a result.
Common mistakes to avoid
- Studying syntax without using it. After learning a concept, apply it to a small dataset or reproduce a calculation from class.
- Choosing a tool before checking requirements. Find out what your instructor, research group, or intended project expects before installing packages or building a workflow.
- Treating output as an explanation. A table or model result does not interpret itself. Explain the method, assumptions, and limits in economic terms.
- Confusing association with causation. A chart or correlation can suggest a pattern, but causal claims need appropriate theory, design, and methods.
- Trying to learn every library at once. Begin with what a specific assignment or project needs; there is no single package list required for every economics student.
Frequently asked questions
Is Python required for economics?
No general requirement is established by the available evidence. Python is used in examples involving econometrics, finance, and computational economics, but individual courses and programs can require different tools. Check your syllabus and department guidance before deciding what to learn.
Is Python useful for econometrics?
It can be. A Springer textbook describes Python being used to teach econometric methods and data analysis, including statistical and regression work. Whether it is the right tool for your class depends on the instructor’s materials and required software (source description).
Should economics students learn Python or R first?
Start with whichever one supports your current course or project. If neither is required, choose one and use it to complete a small analysis before deciding whether you need to learn the other. The supplied evidence does not establish that one is universally more effective for economics students.
Do I need advanced mathematics before learning Python?
You can begin learning basic programming without first mastering advanced mathematics. However, interpreting econometric or statistical results requires the relevant subject knowledge. Learn the programming basics separately, then connect them to methods as you encounter those methods in your studies.
Which Python version should I use for coursework?
Use the version and environment specified by your instructor or course materials. If none is specified, choose a stable release that works with the packages you need rather than a prerelease, and avoid changing versions partway through an assignment without a reason.
Conclusion: learn Python when it serves your economics goals
Python can help economics students handle data, explore econometric methods, create visualizations, and investigate computational or financial questions. Its usefulness depends on what you are studying and what tools your course or project expects. Learn the required methods and software first; add Python when it helps you answer a real question or build a useful, repeatable workflow.
The examples cited here show documented applications, not proof that Python improves grades, employment prospects, or research quality. For further reading, browse the Python resources at Digital Delights and choose a resource that fits your current level and purpose.
Sources and further reading
- Ökonometrie verstehen und anwenden mit Python: Eine Einführung mit praktischen softwaregestützten Beispielen — Springer Nature publisher description of Python-based econometrics teaching and data analysis.
- Applied Quantitative Finance: Using Python for Financial Analysis — Springer description of examples involving economic indicators, financial data, analysis, and risk models.
- Foundations of Mathematical and Computational Economics — Springer publisher information for a computational economics text emphasizing tools other than Python.
- The Python Tutorial — official Python documentation for introductory language concepts.
These sources document examples and learning materials; they are not comparative studies of software effectiveness or evidence that Python is necessary for all economics students.