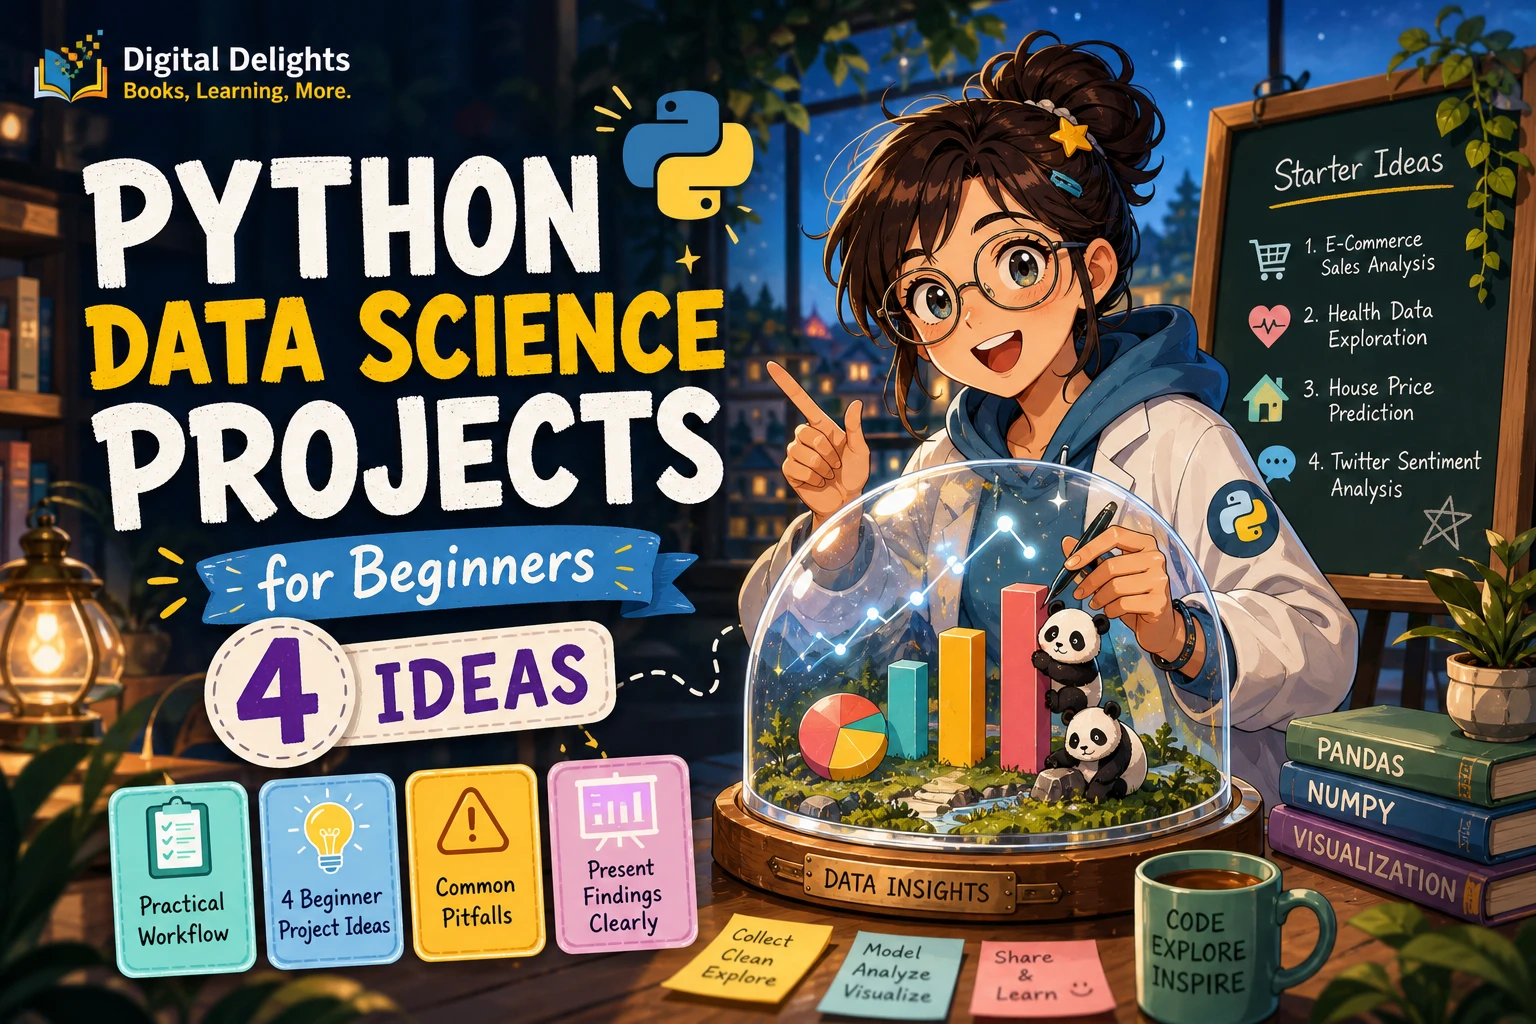
Python Data Science Projects for Beginners: 4 Ideas
If you are starting out in data science, your first project does not need a complicated machine-learning model. Begin with a small, manageable dataset and a question you can answer by inspecting, cleaning, summarizing, and visualizing the data. That process teaches skills you will use in larger projects—and gives you something concrete to explain.
This guide lays out a practical project workflow, four ideas arranged from simpler to more involved, and ways to document your work. You can start with basic Python and a CSV file; machine learning is an optional later step, not a prerequisite.
What Should You Know Before Starting?
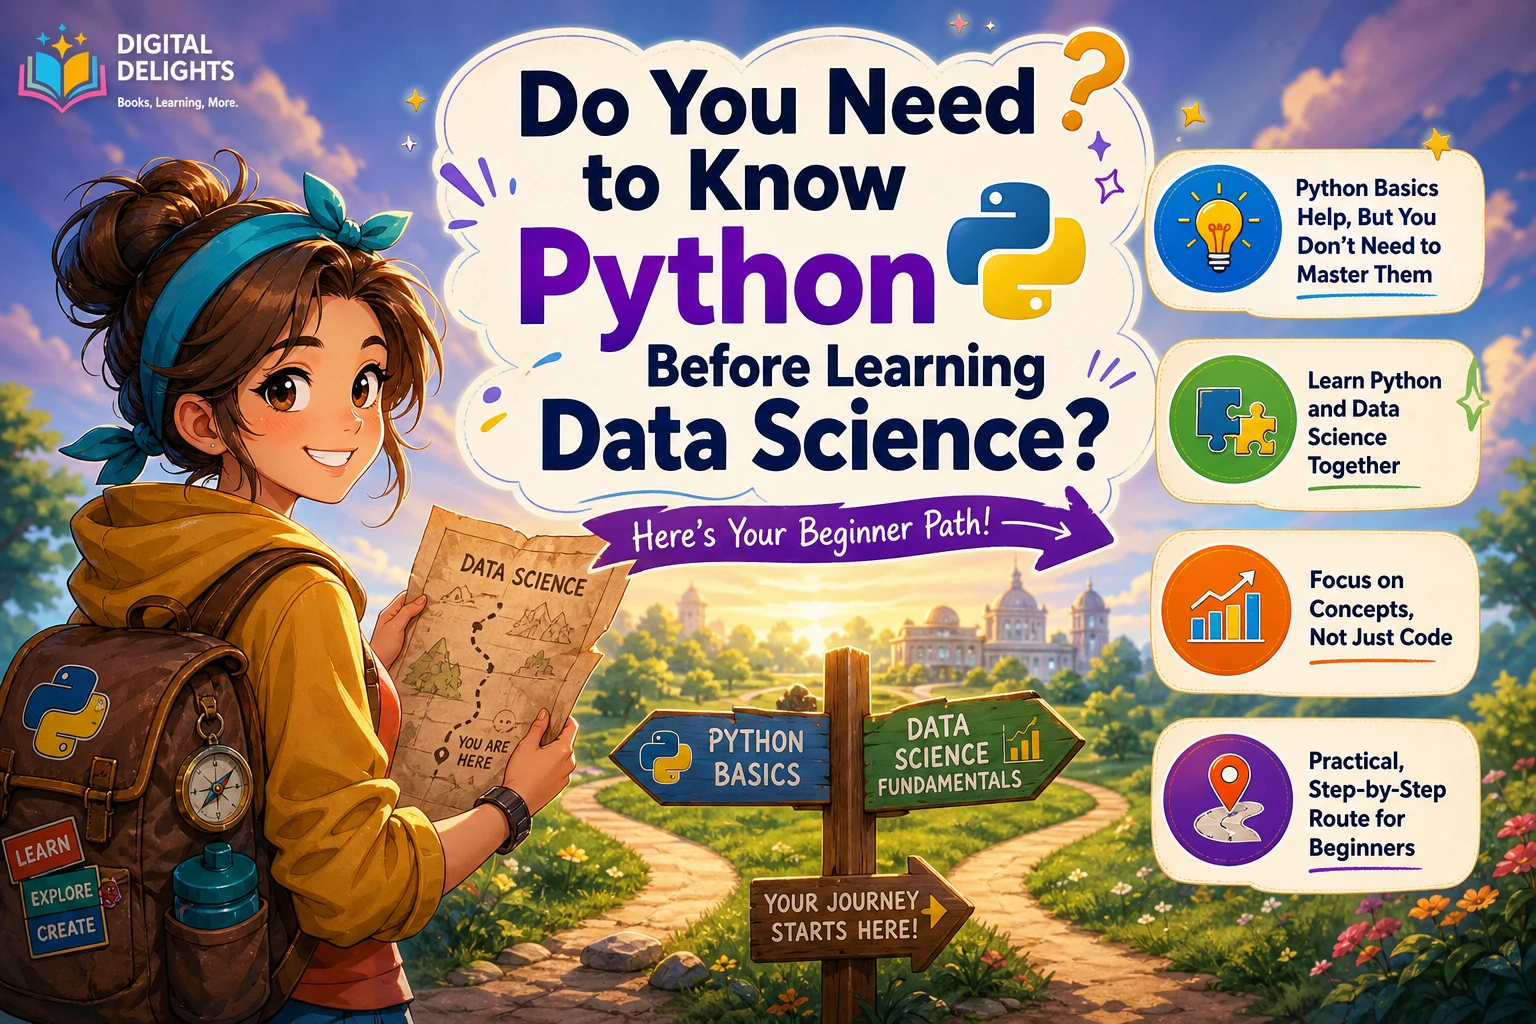
“Beginner” can mean either new to Python or new to programming altogether. Those are different starting points. The official Python tutorial is intended for people new to Python who already have some general programming understanding, so a complete newcomer may benefit from learning fundamentals first.
If you are new to programming
First get comfortable with variables, strings and numbers, lists and dictionaries, conditions, loops, functions, and reading error messages. Practice writing short scripts and breaking a task into steps. You do not need to master every Python feature before trying a small data project; you do need enough confidence to read and adjust simple code.
If you already know another language
Learn Python’s syntax and basic data structures, then try a small file-reading task. You can move into a data project once you understand how to run a script, inspect values, and handle a basic error.
For either path, basic comfort with averages, counts, percentages, and comparisons is helpful. You can learn more statistics as a project requires it rather than delaying all practical work until you have studied the subject extensively.
A Repeatable Workflow for Beginner Data Science Projects
A good project is a sequence of small decisions, not just a chart or a block of code. Use the same general workflow each time, and keep notes about what you changed and why.
- Ask a focused question. For example: Which category appears most often in this dataset? How does a measurement change over time? Avoid broad questions that the available data cannot answer.
- Choose a small dataset. A CSV is a convenient format for a first project. Record where the data came from and what each row and column represents. Check that you are allowed to use and share it; the resources available for this article do not establish dataset-specific licensing or privacy terms.
- Set up a project environment. Keep project files and dependencies organized. Python’s official venv documentation explains how virtual environments isolate packages used by different projects. Install only the libraries your chosen project needs, and note the setup steps.
- Inspect before changing anything. Check the number of rows and columns, column names, data types, missing values, repeated records, and a few sample entries. Do not assume that a column contains what its heading suggests.
- Clean deliberately. Decide how to handle missing, duplicated, inconsistent, or incorrectly formatted values. Write down those decisions. Do not silently remove inconvenient data without explaining the choice.
- Analyze and visualize. Start with counts, averages, ranges, or group comparisons that answer your question. Use a chart only when it makes the pattern easier to understand; label axes and include units where relevant.
- Summarize and state limitations. Describe what the data suggests, what it cannot establish, and what you would check next. A pattern in one dataset does not automatically explain its cause or apply to other situations.
This progression—from handling data to visualization and, optionally, modeling—is a practical learning sequence, not a universal official curriculum. Python data-science references also cover data handling, visualization, and modeling as connected areas; see the Python Data Science Handbook and the Packt book Python for Data Analysis: Step-By-Step with Projects.
Python Data Science Projects for Beginners, Ordered by Difficulty
These are project formats rather than guaranteed results: choose data you can access and understand, and let the question guide the analysis. Start with the first idea and add complexity only when you can explain the steps you have already taken.
| Project idea | Main skills | Good next step |
|---|---|---|
| Explore and summarize a CSV | Loading, inspection, counts, summary statistics | Compare groups or categories |
| Clean data and compare categories | Missing values, formatting, grouping, charts | Explain how cleaning choices affect comparisons |
| Visualize a time-based trend | Dates, ordering, aggregation, line charts | Check whether the pattern is consistent across periods |
| Try a simple predictive model | Features, targets, train/test separation, evaluation | Compare model results with a simple baseline |
1. Explore and summarize a small CSV
Question to investigate: What are the most common values, and what does a typical record look like? Begin by loading a small table, examining its columns and sample rows, and checking for missing entries or duplicates. Then calculate a few useful counts or summary measures and explain what they reveal.
This project is valuable because it makes careful inspection part of the work from the outset. A short summary is more useful than a large collection of numbers: connect each calculation to the question you asked.
2. Clean data and compare categories
Question to investigate: How do two or more groups compare on a chosen measure? First check that the groups are represented consistently. For example, inconsistent spelling or extra spaces can make one category appear as several. Document how you standardized values and how you treated missing information, then compare the groups using a suitable summary and chart.
Keep the conclusion narrow. If one group has a higher average in your dataset, report that observation; do not claim that group membership caused the difference unless the study design and evidence support that conclusion.
3. Visualize a time-based trend
Question to investigate: How does a recorded value change over time? Check that dates are valid and consistently interpreted, sort records chronologically, and decide whether to show individual observations or aggregate them by a meaningful period. A line chart can make a time sequence easier to inspect, but it does not explain why a change occurred.
Note gaps in the dates and any changes in how the data was collected. These details may affect how a reader interprets a trend.
4. Optional: try a simple predictive model
Question to investigate: Can a model estimate a clearly defined outcome from information available in the dataset? Attempt this only after you can inspect and prepare the data and explain which column is the outcome you want to predict.
Keep the first modeling exercise modest. Separate the data used to fit a model from the data used to assess it, choose an evaluation measure that suits the task, and compare the result with a simple baseline. A model score is not proof that a model will perform equally well on new data. Because model-evaluation methods and library compatibility are not covered by the evidence available here, treat this as a next learning stage and consult current documentation for the tools you choose.
How to Make a Project Portfolio-Ready
A reader should be able to understand the question, follow your main decisions, and see the limits of your conclusion without guessing what happened between the code and the final chart.
- State the question and scope. Say what you set out to examine and what you did not try to answer.
- Describe the dataset. Explain its source, general contents, and any relevant restrictions or caveats.
- Show your process. Summarize the checks, cleaning choices, calculations, and visualizations that shaped the result.
- Present a small number of findings. Use clear charts or concise tables, with labels that explain what is being shown.
- Be candid about limitations. Mention missing data, narrow coverage, assumptions, or other factors that might change the interpretation.
- Make the work reproducible where possible. Include the files or instructions someone needs to understand how to run it, subject to any dataset sharing rules.
These are practical editorial recommendations rather than a formal portfolio standard. The aim is clarity: show how you reasoned, not just the most polished output.
Common Beginner Pitfalls to Avoid
- Starting with complex machine learning. A model cannot compensate for a vague question or poorly understood data. Begin with inspection and simple summaries.
- Skipping data checks. Unexpected blanks, duplicate records, or inconsistent labels can change the analysis. Inspect before drawing conclusions.
- Overclaiming. Describe what the dataset shows, not what you wish it proved. Association, trend, and cause are not interchangeable claims.
- Leaving setup undocumented. Note the Python environment and required packages so you can revisit the project and identify setup issues.
- Choosing a project too broad to finish. Limit the first question, dataset, and number of charts. A clear small project is easier to explain than an unfinished attempt to analyze everything.
- Copying steps without understanding them. If you use a tutorial or book, pause to explain what each transformation or chart contributes to your question.
Learning Resources for Your Next Step
Choose a resource that matches the skill you need next; one book does not have to cover every stage. Product descriptions in the Digital Delights catalog identify the following relevant topics:
- Python Crash Course: A Comprehensive and Fast-Paced Introduction to Python Programming for Beginners and Experienced Developers Alike covers Python fundamentals and project work, including data analysis. It may suit a learner who wants to strengthen general Python skills while moving toward practical examples.
- Python for Data Science: After work guide to start learning Data Science on your own. Avoid common beginners mistakes of coding. Approach Panda and NumPy to become a brilliant computer programmer | Python for Data Science is described as an introduction to NumPy, Pandas, Matplotlib, and machine-learning basics. Consider it if you want a resource focused on data-science tools and concepts.
- Python for Data Analysis: A Beginner’s Guide to Learn Data Analysis with Python Programming covers Python foundations and data-analysis topics, including NumPy, SciPy, Pandas, and Matplotlib. Its listed scope may suit readers looking for a broader introduction to analysis and related tools.
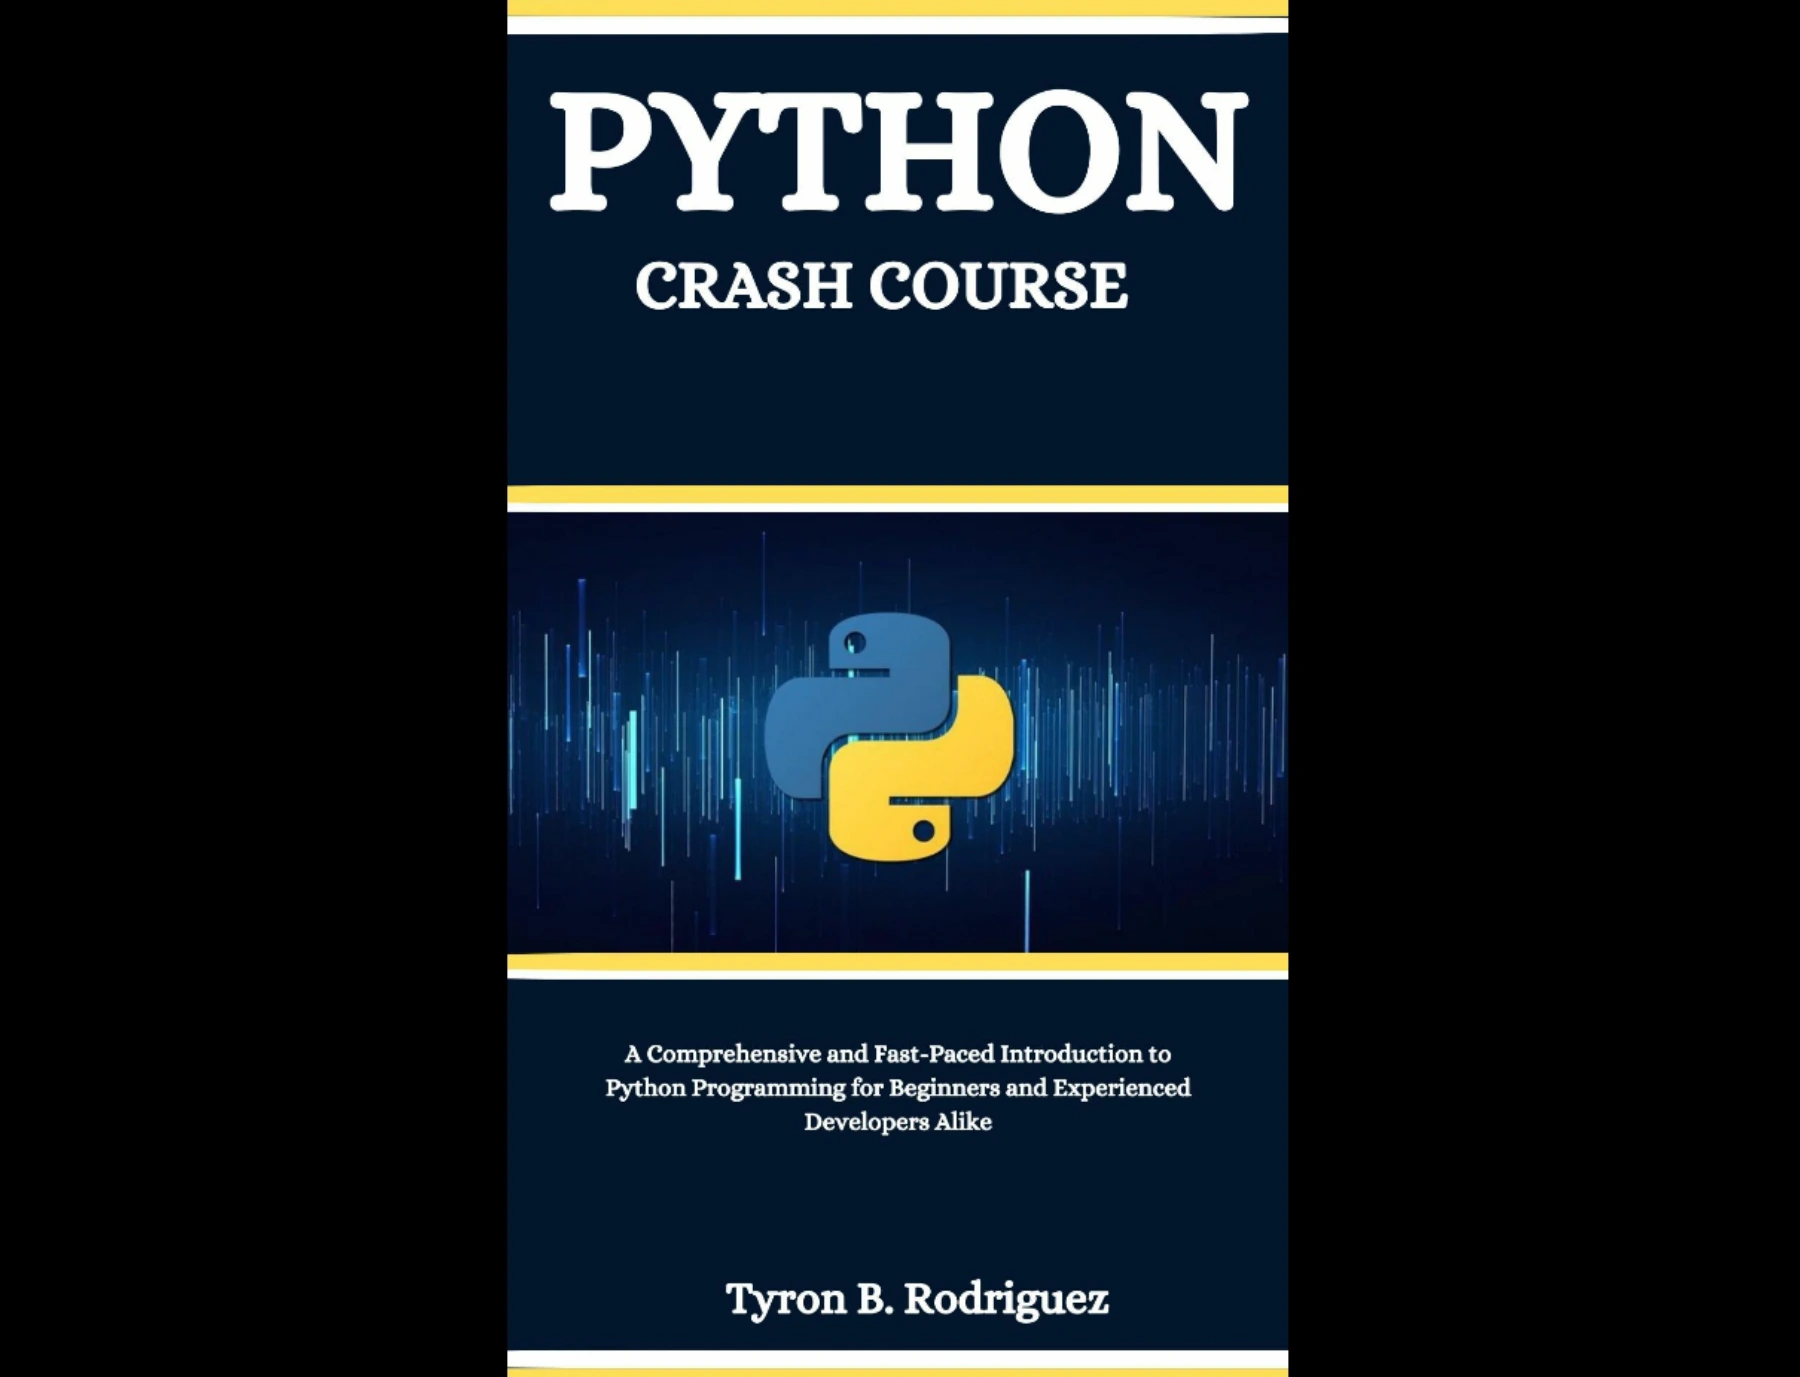
Learners who want core Python concepts alongside project work, including data analysis.
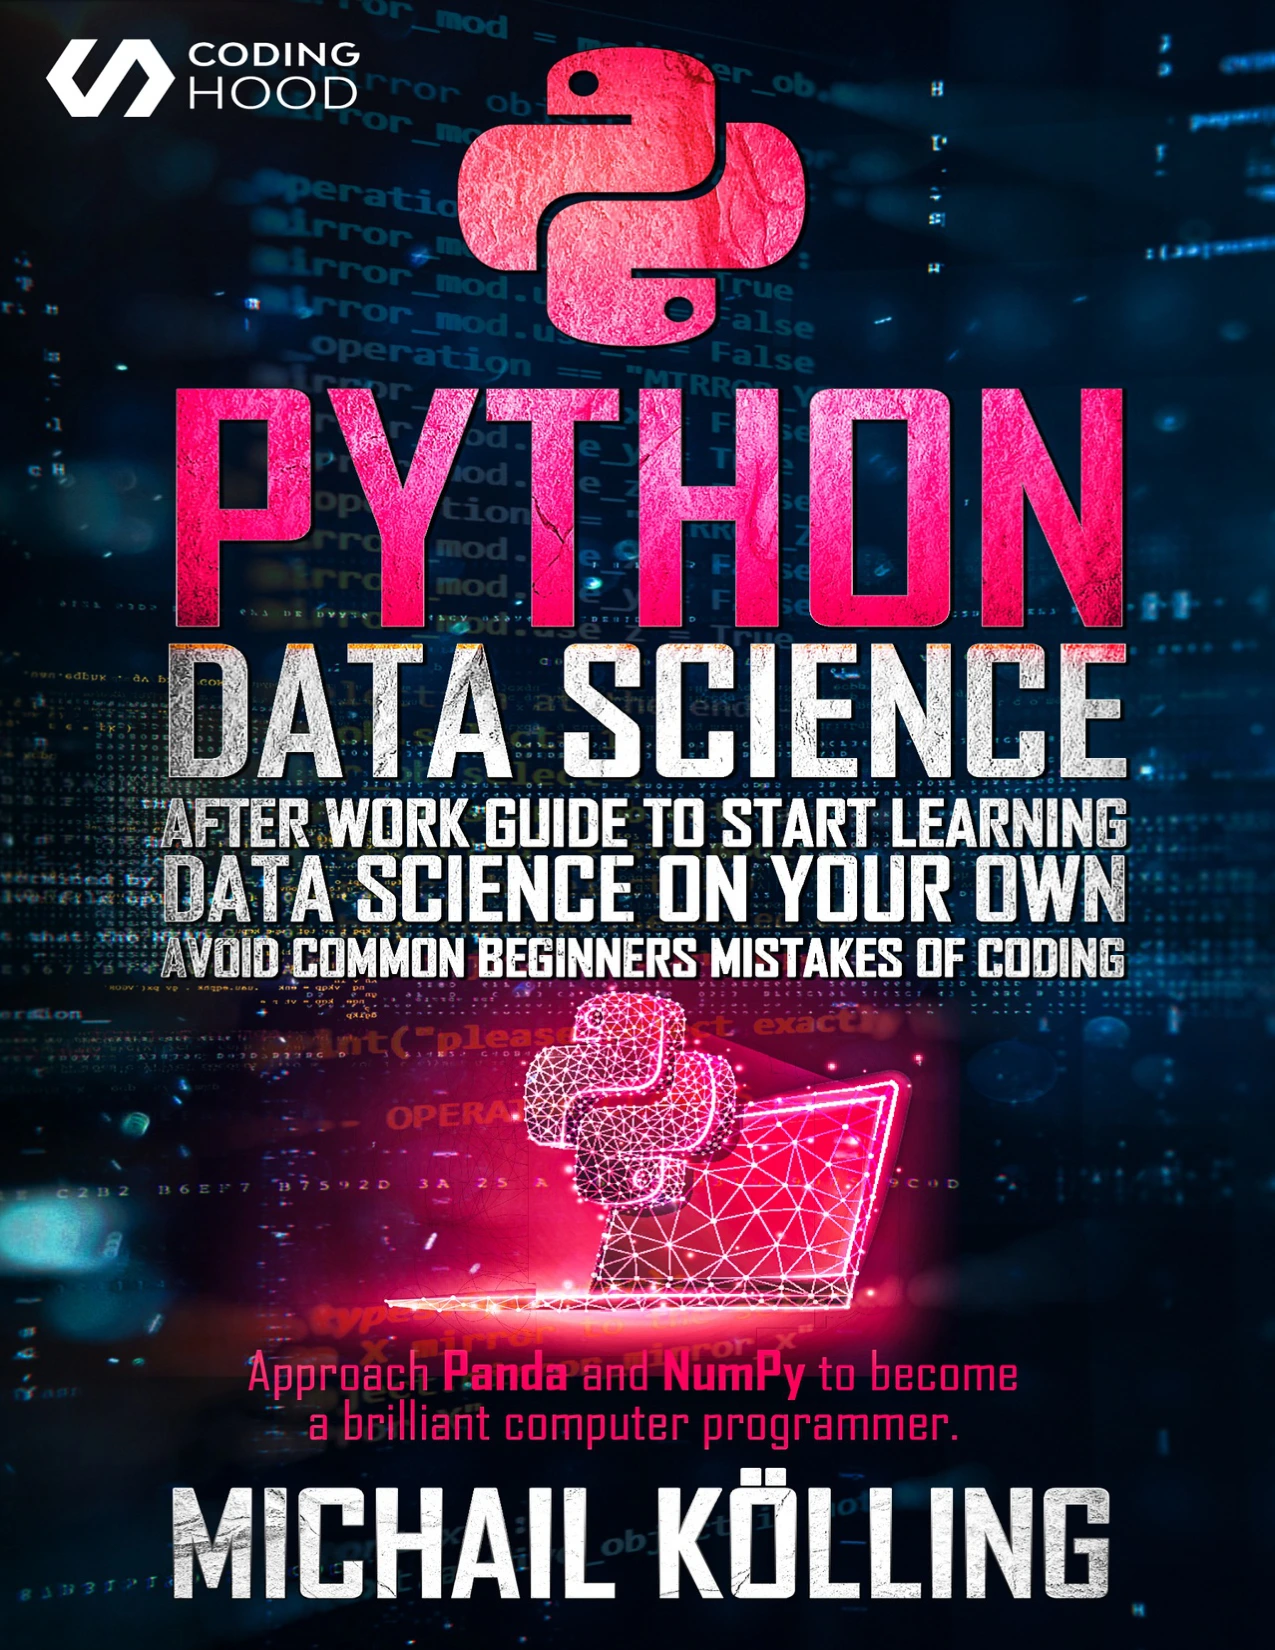
Self-directed learners seeking an introduction to NumPy, Pandas, Matplotlib, and machine-learning basics.
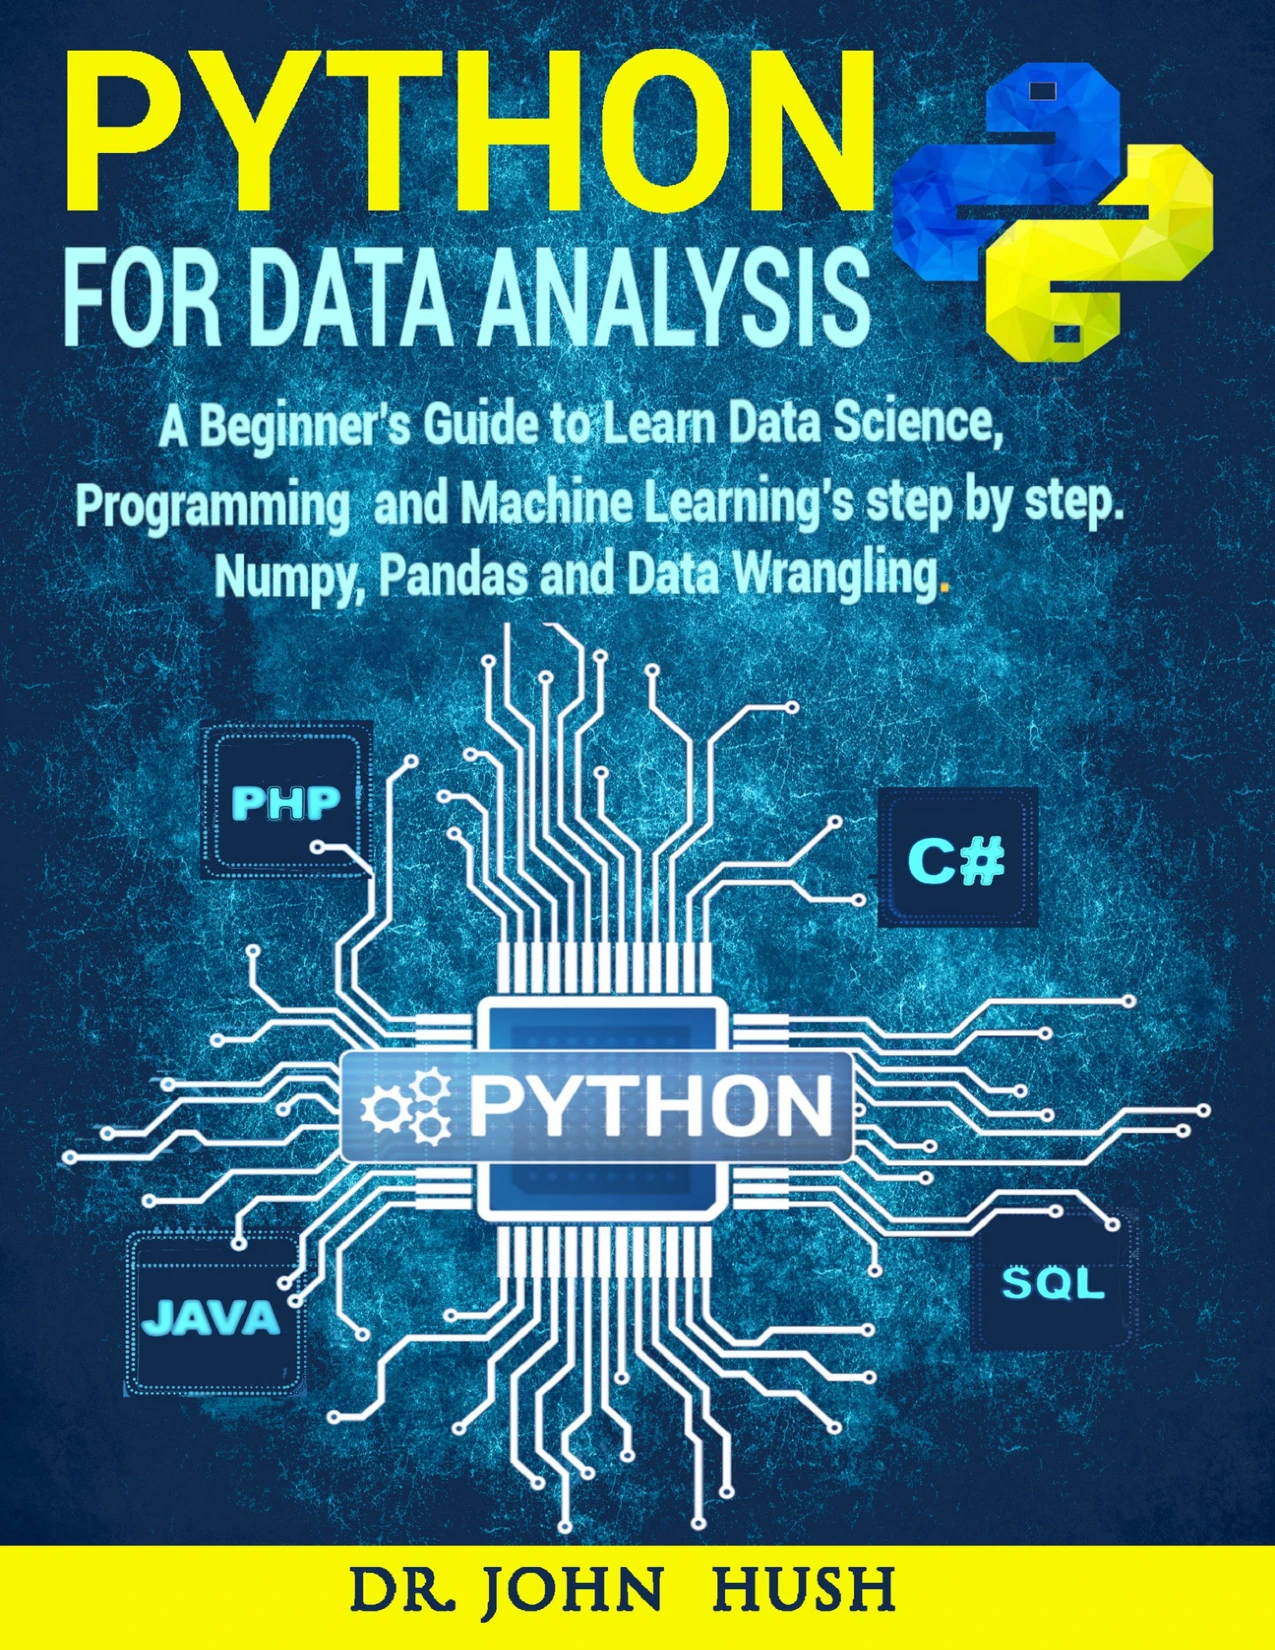
Python for Data Analysis: A Beginner’s Guide to Learn Data Analysis with Python Programming
Beginners looking for Python foundations and coverage of tools such as NumPy, SciPy, Pandas, and Matplotlib.
These descriptions reflect catalog information; they do not verify that every example or setup instruction works with current software versions. Check the resource’s details and consult current official documentation when a version-specific instruction matters.
Frequently Asked Questions
Do I need to know Python before starting a data science project?
You need enough Python to run a script, work with basic data structures, and understand simple errors. If you are new to all programming, learn core concepts first; if you already know another language, focus on Python basics before working through a small dataset.
What is a good first Python data science project?
Start by exploring and summarizing a small CSV. Inspect its rows and columns, check for missing or repeated records, calculate a few summaries, and explain what those summaries do—and do not—show.
Do beginner data science projects need machine learning?
No. Data inspection, cleaning, analysis, and visualization are complete and useful project skills on their own. Add a predictive model only when you have a clear outcome to estimate and can explain how you assess the result.
How should I share or document a beginner project?
Write a short project overview with the question, data source, cleaning decisions, main findings, and limitations. Include clear charts and enough setup information for someone to understand the work, while respecting any data-use restrictions.
Conclusion
The most useful Python data science projects for beginners are not necessarily the flashiest. A small, well-explained analysis can show that you know how to ask a question, inspect data, make deliberate choices, and communicate a careful conclusion. Begin with a CSV summary, then add cleaning, comparisons, time-based charts, and—when you are ready—a simple predictive model. Keep each step understandable, and let the question determine what you learn next.
Sources and Further Reading
- The Python Tutorial — official Python documentation describing the tutorial’s intended audience.
- venv — Creation of virtual environments — official documentation for isolated Python environments.
- Python Data Science Handbook — publisher reference page.
- Python for Data Analysis: Step-By-Step with Projects — publisher reference page.