What Python Libraries Should You Learn for Data Science?
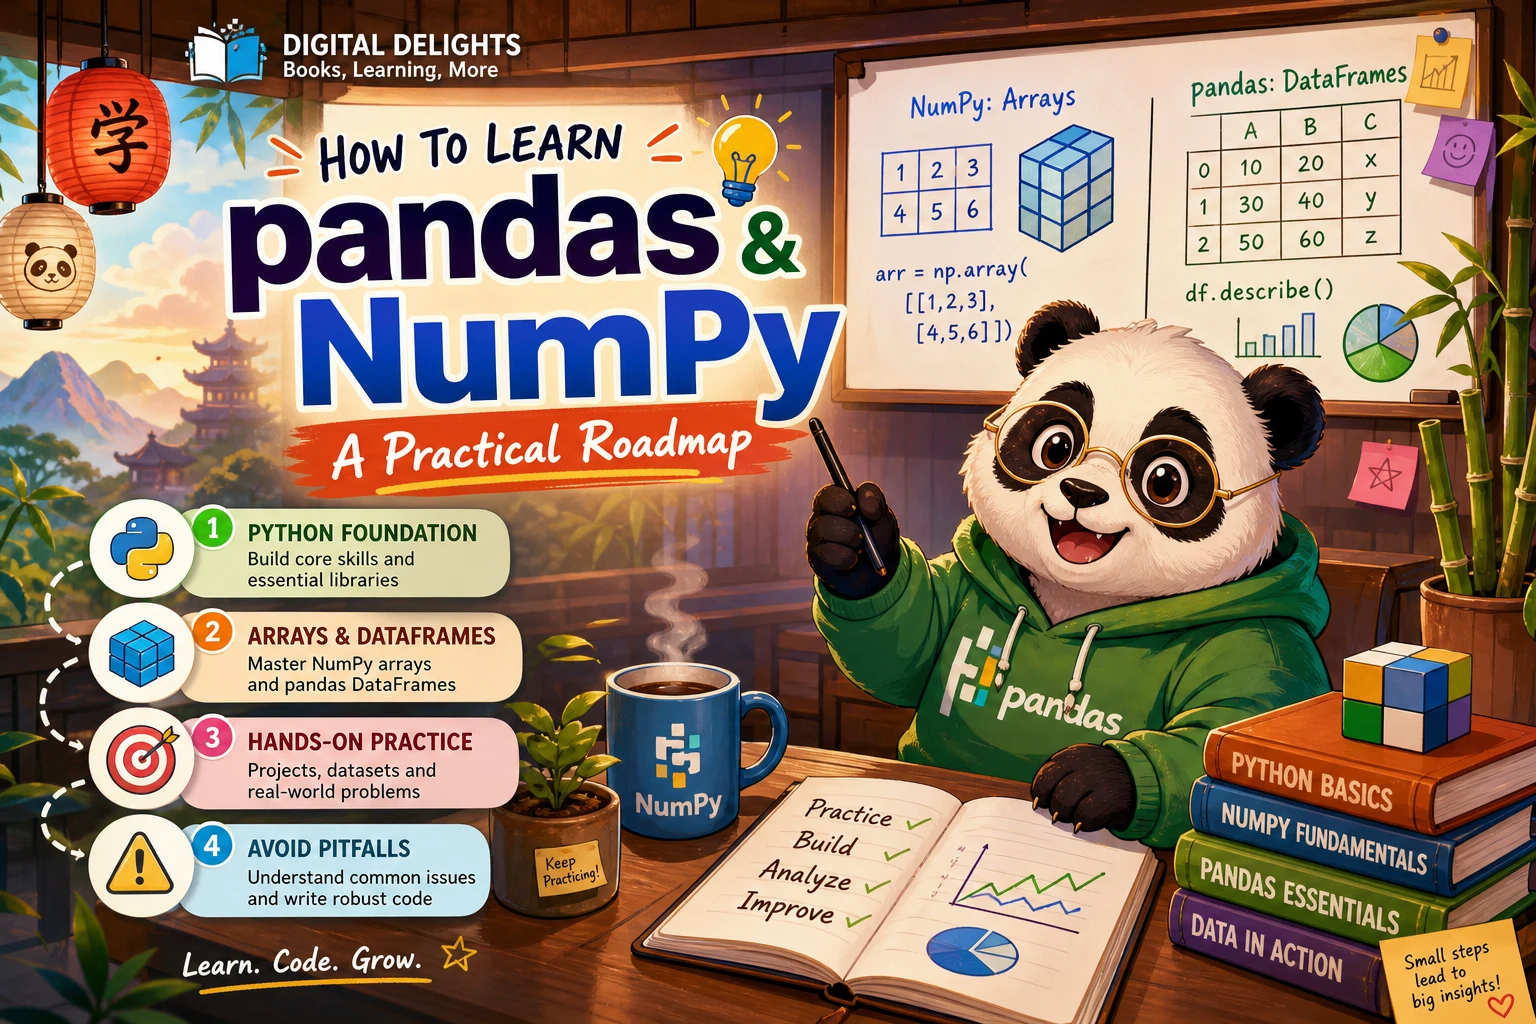
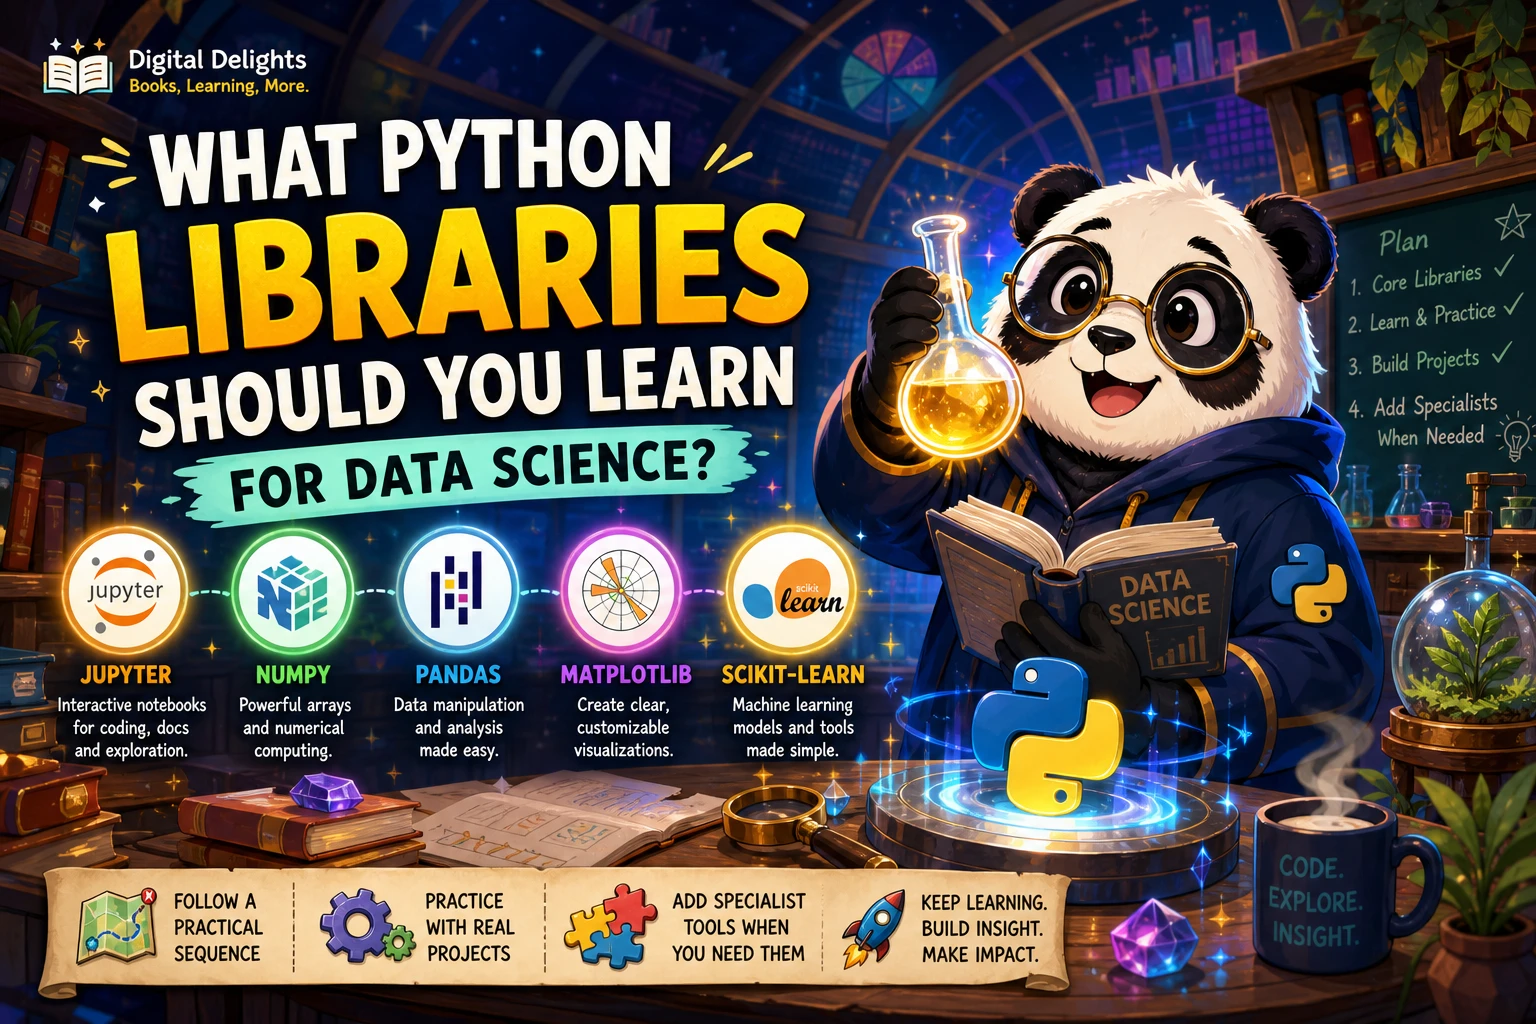
You do not need to learn every Python library before you can start working with data. For a general-purpose foundation, begin with Jupyter for interactive work, NumPy for numerical arrays, pandas for tabular data, Matplotlib for charts, and scikit-learn for introductory machine-learning workflows. Learn them in stages, using a small dataset to connect each tool to a real task.
The best sequence depends on what you want to do, so treat this as a practical starting path rather than a universal ranking. This guide explains what each library or tool is for, how the pieces work together, when to add SciPy or specialist tools, and how to practise without getting overwhelmed.
Quick answer: start with the core Python data science stack
- Jupyter Notebook: Work interactively with code, notes, and output in one document.
- NumPy: Create and work with numerical arrays and perform array-based calculations.
- pandas: Load, inspect, clean, transform, and summarize tabular data.
- Matplotlib: Create charts to explore and communicate data.
- scikit-learn: Build and evaluate common machine-learning models using a consistent toolkit.
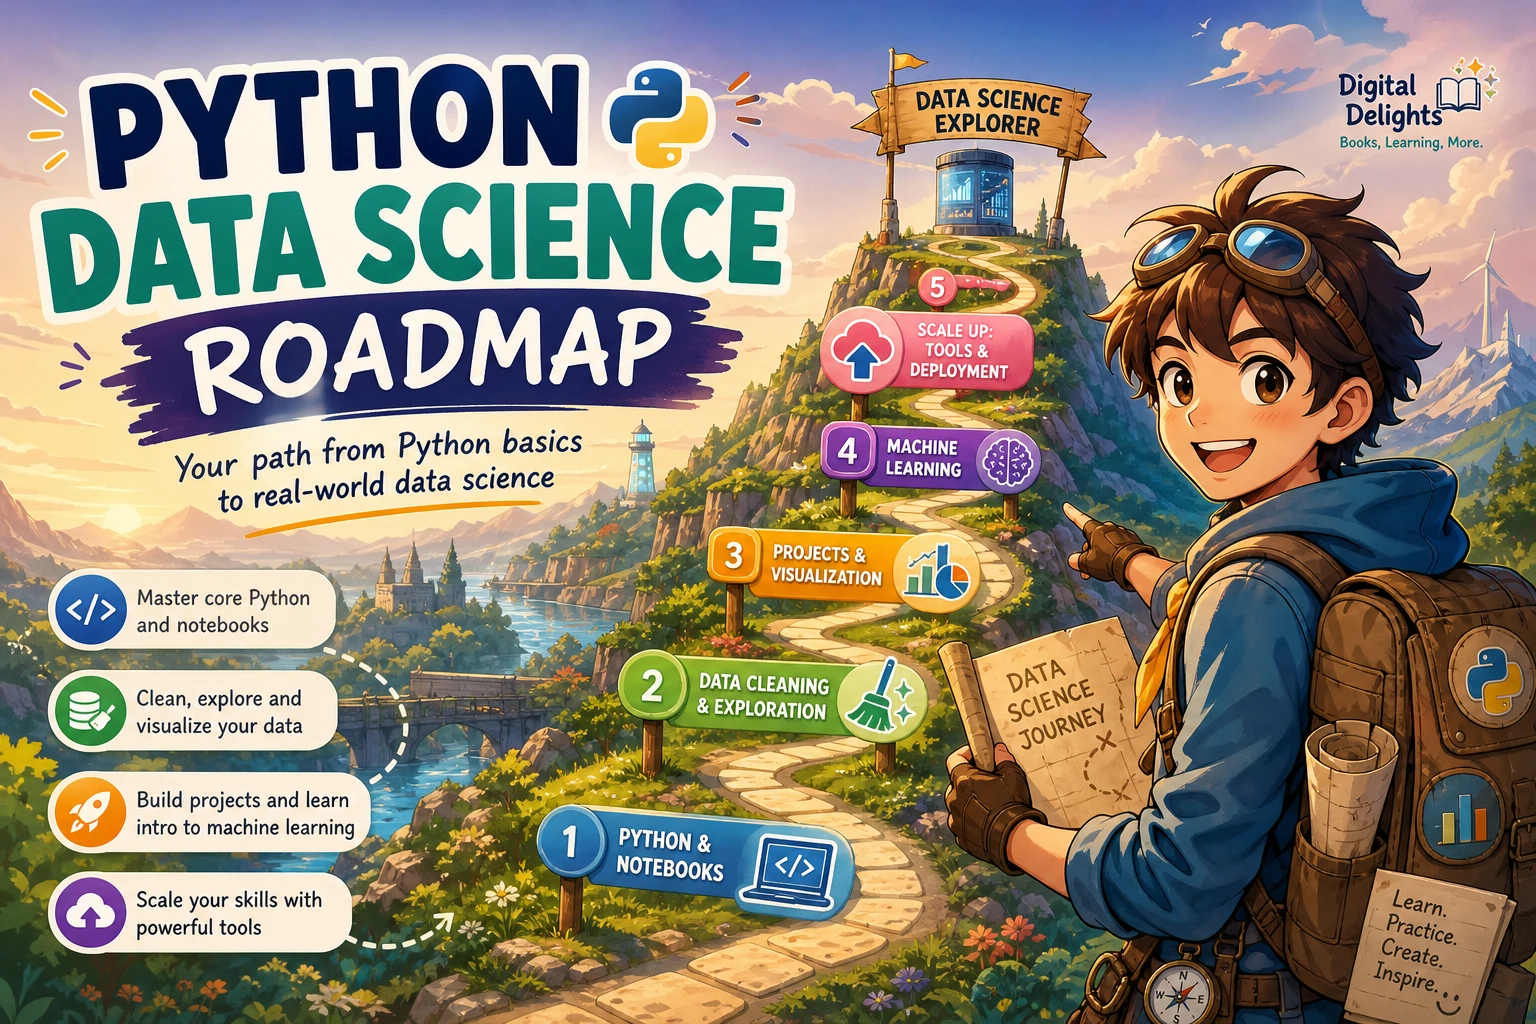
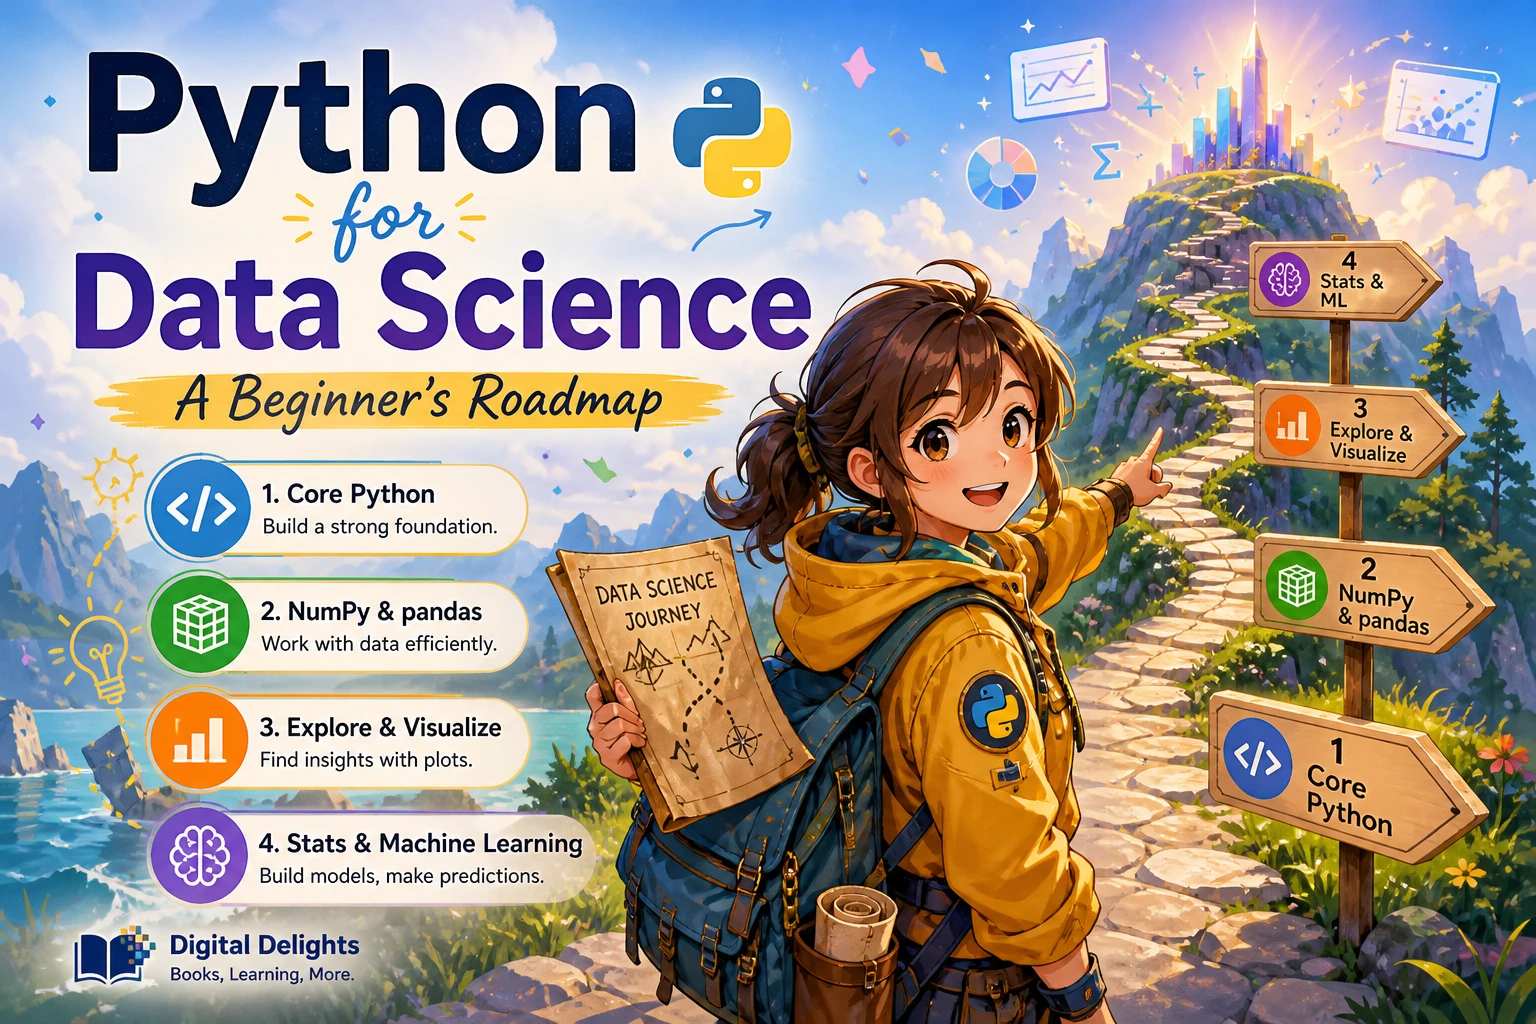
A useful learning order is Python fundamentals → Jupyter → NumPy basics → pandas → Matplotlib → scikit-learn. You can use Jupyter while learning the other tools; it is a working environment, not a data-science library in the same sense as NumPy or pandas. Publisher materials group these tools as part of the Python data-science stack, while describing their different roles. Source: Python Data Science Handbook.
What each Python data science tool helps you do
Jupyter: explore a question in small steps
Jupyter notebooks let you put executable code alongside written explanations and results. That makes them useful for exploratory analysis: you can load a dataset, try a calculation, inspect the output, and record what you learned in the same document.
For example, while studying monthly sales, you might write a brief note about the dataset, calculate totals in code, and display a chart immediately below. A notebook can make this investigation easier to follow, but it does not replace understanding Python or keeping track of your project’s files and environment.
NumPy: work with numerical arrays
NumPy provides tools for numerical computing, especially arrays and operations on them. It is useful when you need to organize numeric values and perform calculations across many values rather than handling each one separately. Other tools in the scientific Python ecosystem also build on or work with NumPy.
A simple starting exercise is to represent a sequence of measurements as an array and calculate its minimum, maximum, or average. You do not need to master every NumPy feature before using pandas, but understanding arrays and basic operations will make later data work less mysterious. Source: Python for Data Science, Chapter 3.
pandas: handle tables and prepare data
pandas is designed for labeled, tabular data, such as a CSV file containing dates, product names, and sales figures. Its DataFrame structure lets you select columns, filter rows, handle missing values, combine tables, and group records for summaries.
Suppose a file contains transactions with inconsistent date formats and blank amounts. With pandas, you can load the file, inspect its columns, standardize or convert values, and calculate totals by month. Data preparation is not just a preliminary chore: the quality and structure of the data affect what conclusions you can draw.
For a focused reference on tabular data work, Python for Data Analysis: Data Wrangling with pandas, NumPy, and Jupyter, Third Edition covers pandas, NumPy, notebooks, data loading, cleaning, reshaping, aggregation, and visualization. It may suit learners who want a dedicated guide to the day-to-day process of working with datasets.
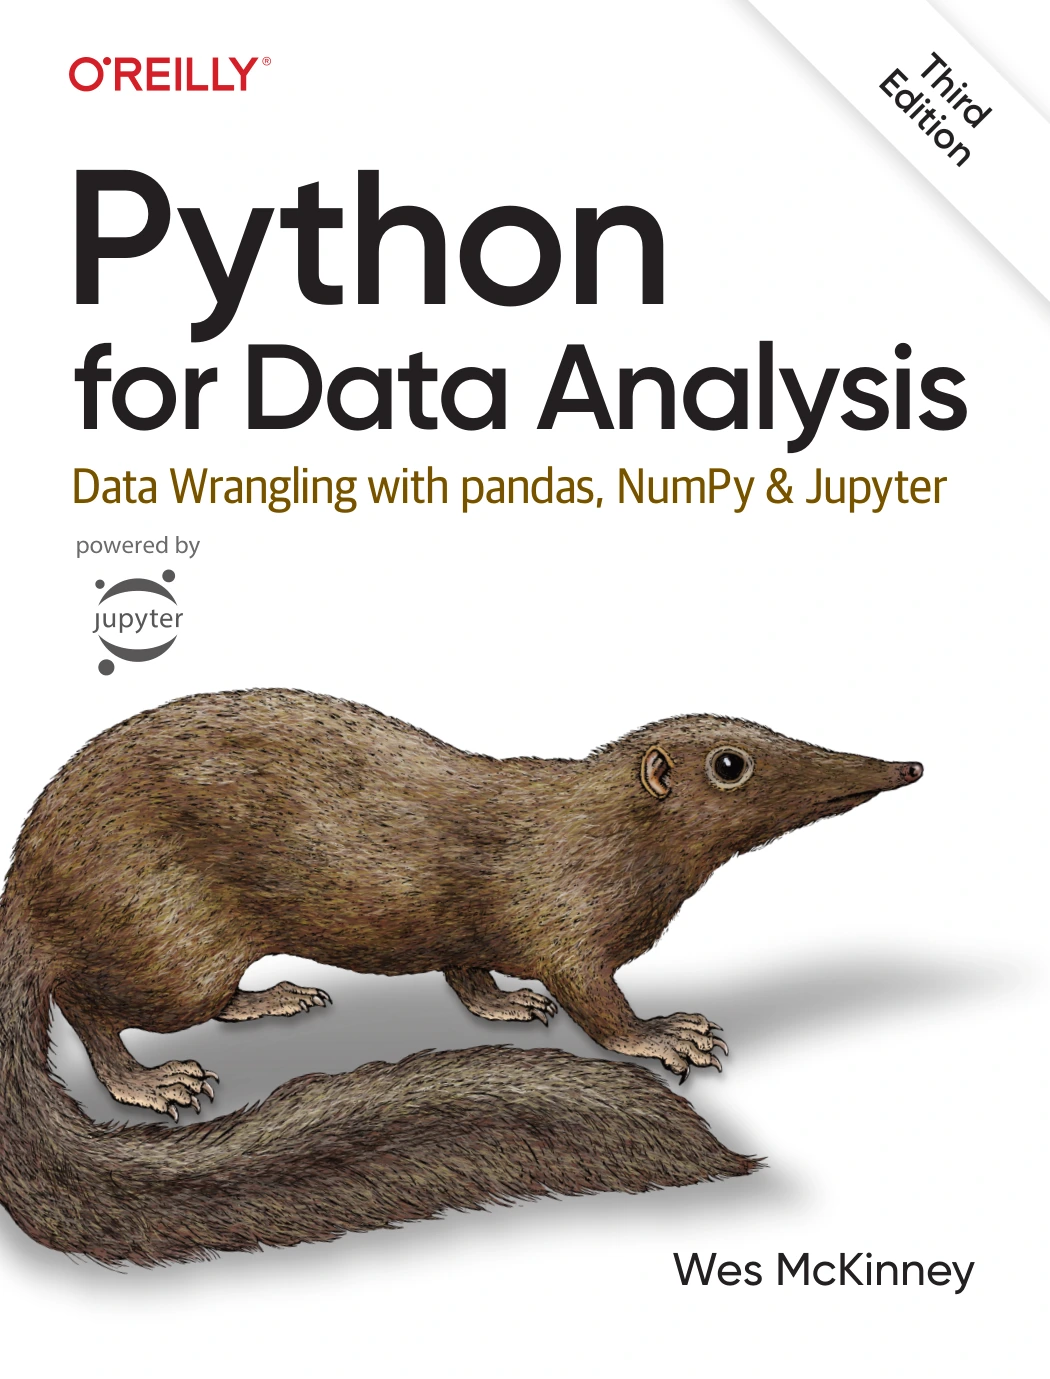
Python for Data Analysis: Data Wrangling with pandas, NumPy, and Jupyter, Third Edition
By Wes McKinney
Learners seeking a dedicated guide to tabular data, notebooks, cleaning, and wrangling.
Matplotlib: see patterns in your data
Matplotlib is a plotting library for creating visualizations in Python. A chart can help you examine distributions, compare categories, or see how a value changes over time. It is useful both during analysis and when you need to communicate a result clearly.
Start with a few chart types that match common questions: a histogram to inspect a distribution, a bar chart to compare categories, or a line chart to view change over time. Choose a chart based on the question and the structure of the data, rather than adding a visualization simply because the tool makes one possible. The Python data-science stack described in publisher material includes Matplotlib alongside tools for analysis and modeling. Source: Python Data Science Handbook.
scikit-learn: build introductory machine-learning workflows
scikit-learn provides a toolkit for common machine-learning tasks, including preparing data for models, fitting estimators, and evaluating results. It is a sensible next step once you can inspect and prepare a dataset, and understand what question a model is meant to answer.
For example, after preparing a table of labeled records, you could use a classification workflow to predict a category and then evaluate how well the predictions match known labels. Learning a library’s API is not a substitute for understanding the data, the target, or the limits of an evaluation. A publisher overview also groups scikit-learn with NumPy and pandas as key tools in Python data analysis. Source: Python for Data Science, Chapter 3.
A practical order for learning Python libraries for data science
This order is a learning suggestion based on how the tools can fit into a basic workflow, not a measured ranking of library importance.
- Learn core Python first. Practise variables, lists and dictionaries, loops, functions, imports, and reading simple files. You do not need advanced programming before exploring data, but basic fluency helps you understand examples and troubleshoot errors. The official Python tutorial is intended for readers with some basic programming knowledge. Python Tutorial.
- Use Jupyter for short investigations. Learn how to run cells, add notes, inspect output, and save a notebook. Use it as a workspace while you learn, rather than treating notebook shortcuts as a replacement for Python fundamentals.
- Study NumPy essentials. Learn how to create arrays, select values, understand array shape, and perform basic operations. Focus on concepts you can apply to data rather than trying to memorize every function.
- Move into pandas. Load a dataset, inspect its columns and data types, filter rows, handle missing values, and produce grouped summaries. This is where many end-to-end data exercises begin to feel concrete.
- Add Matplotlib. Make a small number of clear plots from the same dataset. Practise choosing a chart that answers a specific question and labeling it so someone else can interpret it.
- Try scikit-learn when you have a modeling question. Learn the basic flow of preparing features, fitting a model, and evaluating predictions. Do not begin with a model simply because machine learning sounds like the most advanced part of data science.
If you prefer to learn through a connected project rather than individual library exercises, The Data Science Workshop covers practical Python data work and progresses into topics such as regression, classification, clustering, and model evaluation. Its project-oriented coverage may be useful after you have some familiarity with Python and data handling.
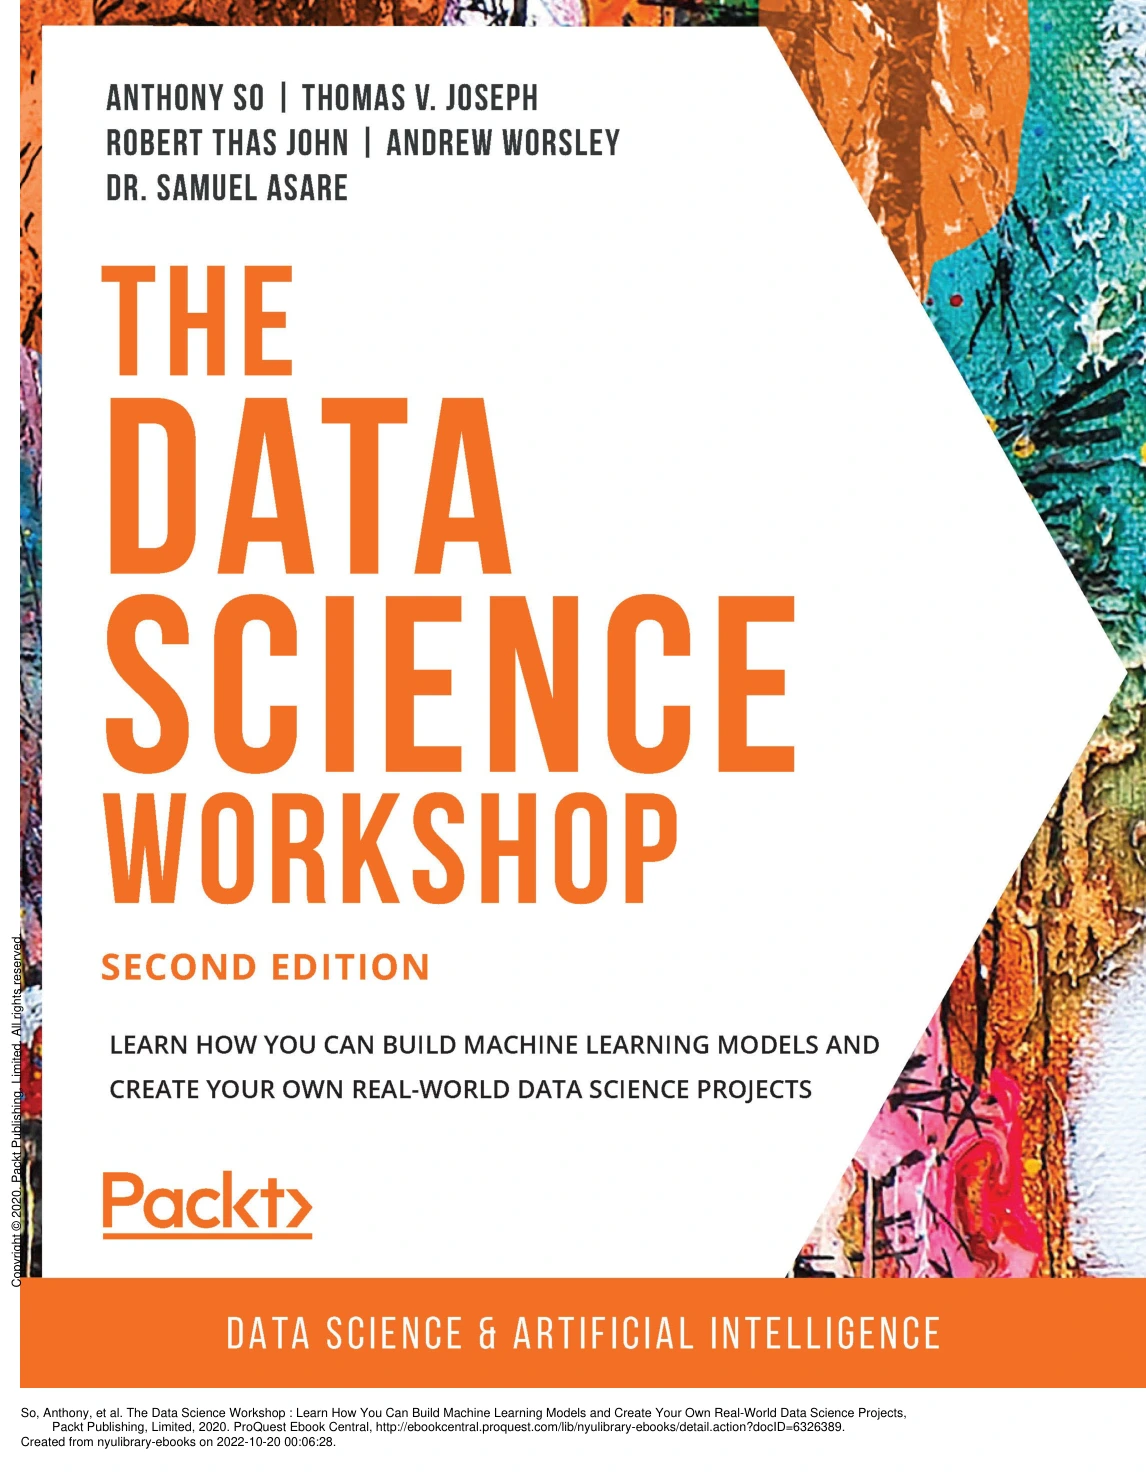
By Anthony So
Readers with some Python familiarity who want practical coverage of data workflows, regression, classification, clustering, and evaluation.
How to practise the stack on one small dataset
Choose a modest dataset with a clear question, such as whether monthly sales changed, which categories appear most often, or how measurements vary. Keep the first exercise small enough that you can understand the whole path from raw file to conclusion.
- Load and inspect: Open the dataset in a notebook and check its rows, columns, and types.
- Clean deliberately: Look for missing values, inconsistent labels, duplicate records, or dates that need conversion. Decide what to do and note the decision rather than silently changing values.
- Summarize: Use pandas to calculate a few totals, averages, or group summaries that relate to your question.
- Plot: Make a chart that reveals a pattern or helps compare groups. Check that the labels, units, and scale are understandable.
- Consider a model only if it helps: If the question is predictive and you have suitable data, try a simple scikit-learn workflow. Otherwise, a careful descriptive analysis may be the more appropriate result.
- Explain the outcome: Write down what the analysis shows, what it does not establish, and what you would check next.
This approach gives each tool a purpose: Jupyter holds the investigation, pandas organizes the table, NumPy supports numerical work, Matplotlib helps you inspect patterns, and scikit-learn is available when a modeling task is justified.
When should you learn SciPy or specialist libraries?
You can add libraries as your projects call for them; you do not need to collect tools in advance.
- SciPy: Consider it when your work needs scientific or mathematical computing beyond basic array operations. Publisher material describes SciPy as part of the scientific Python ecosystem alongside NumPy, pandas, Matplotlib, and Jupyter. Source: Streamlining Your Research Laboratory with Python, Chapter 9.
- Deep-learning frameworks: Explore these later if a project specifically involves neural networks or deep learning. They are not prerequisites for every beginner learning data analysis or conventional machine-learning workflows.
- Other specialist tools: Add tools for a defined need—such as a particular data format, statistical method, or visualization requirement—rather than trying to study every package mentioned in tutorials.
For an applied introduction that moves from data preparation into model building and evaluation, Python Machine Learning By Example, Fourth Edition describes practical projects involving preprocessing, feature engineering, model training, and evaluation. It is aimed at readers moving toward machine learning, not as a substitute for learning Python basics or pandas first.
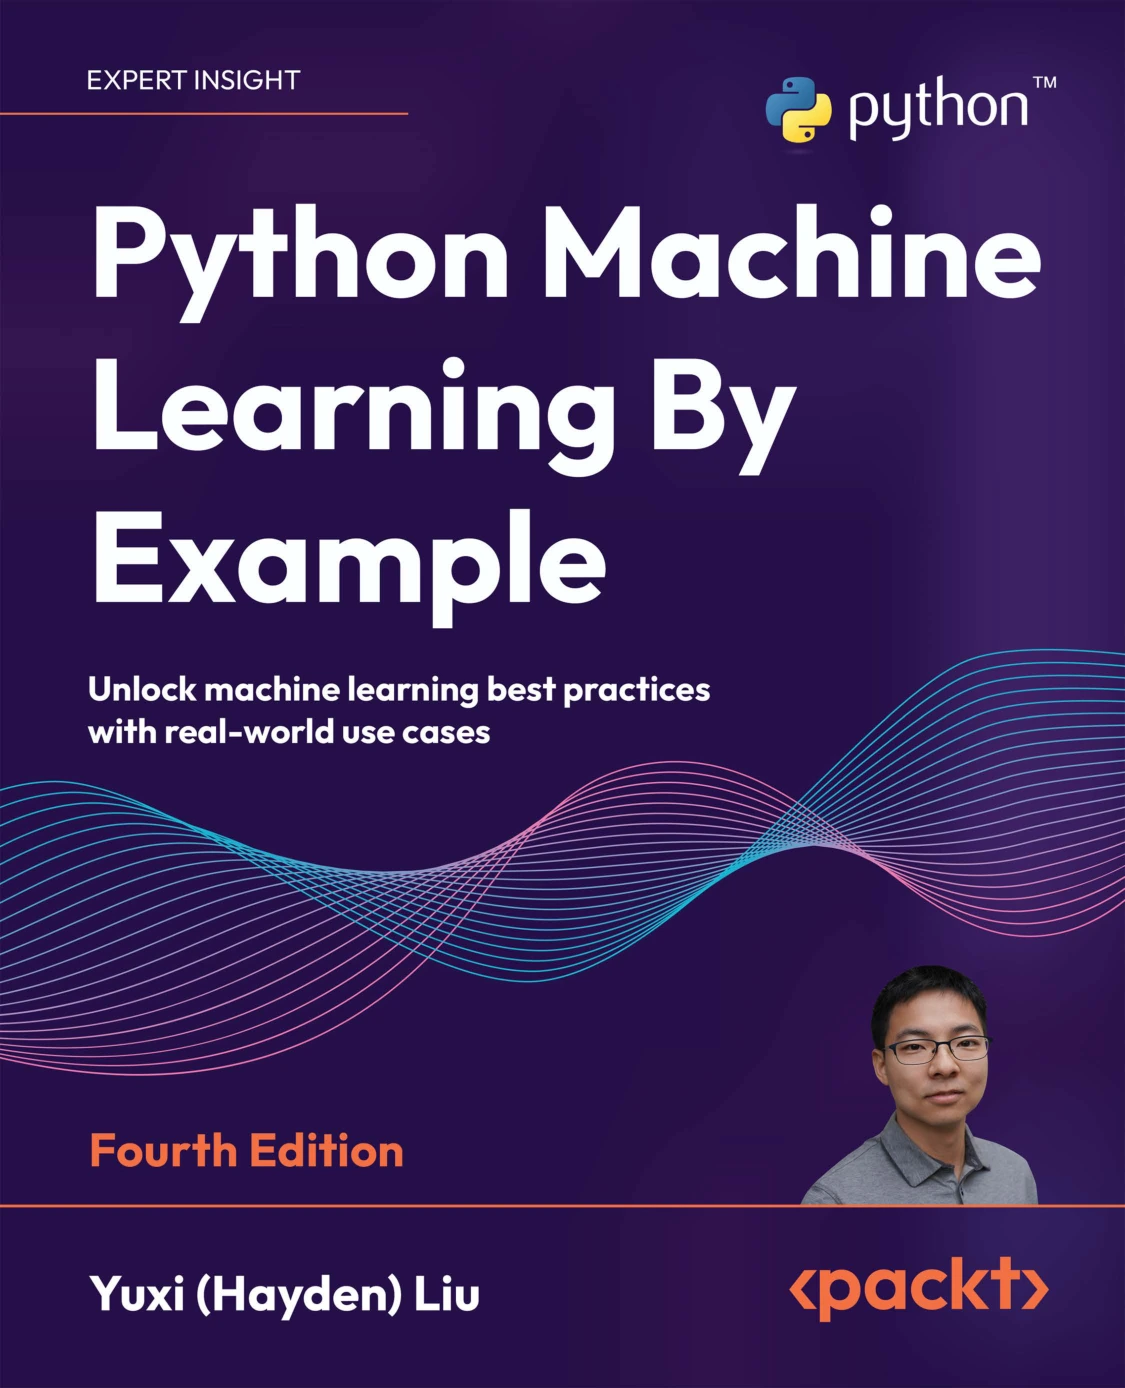
Python Machine Learning By Example, Fourth Edition
Learners ready to study machine-learning projects involving preprocessing, feature engineering, training, and evaluation.
Python environments and package versions
Separate projects can depend on different versions of Python packages. An isolated environment helps keep one project’s installed packages from interfering with another’s. Python’s venv module provides a way to create virtual environments for this purpose. Python documentation: Virtual Environments and Packages.
When starting a project, follow its setup instructions and check the current compatibility requirements for the Python release and packages you plan to use. The research available for this article does not verify current compatibility across every library and Python version, so avoid assuming that an instruction written for one setup applies unchanged to another.
Common mistakes when learning data science libraries
- Trying to learn too many packages at once. Start with a small core and add tools when you can name the problem they will solve.
- Jumping to machine learning before understanding the data. Practise inspecting, cleaning, and summarizing tables first. A model cannot correct an unclear question or automatically make poor data suitable.
- Memorizing functions instead of completing tasks. Learn by answering a question with a dataset; look up specific methods as they become relevant.
- Skipping visualization. A simple chart can expose an unexpected distribution or trend that a summary number alone may not show.
- Copying setup commands without checking context. Package requirements change. Use project-specific instructions and an isolated environment where appropriate.
- Treating a suggested order as a rule. The sequence here is a useful general route, but a project focused on scientific computing, reporting, or prediction may call for a different emphasis.
Frequently asked questions
Do I need Python basics before learning data science libraries?
Basic Python knowledge is a helpful starting point. Learn enough to read and write simple expressions, work with common data structures, use loops and functions, import modules, and understand errors. You can then practise library skills alongside small data tasks. Python’s tutorial itself is intended for readers with some basic programming knowledge: official Python Tutorial.
Should I learn NumPy before pandas?
Learning basic NumPy concepts first can help you understand arrays and numerical operations used across the ecosystem. You do not have to finish all of NumPy before starting pandas. A practical approach is to learn the array essentials, then work with pandas tables and return to NumPy when a project requires more depth.
Is Jupyter a Python library?
Not in the same way as NumPy, pandas, or scikit-learn. Jupyter is a notebook environment for writing and running code alongside notes and output. It is useful for interactive analysis, but it does not replace those libraries.
Does every data scientist need machine-learning or deep-learning libraries?
No single toolset is necessary for every data task. Some work centers on collecting, cleaning, summarizing, and visualizing data; other work involves predictive modeling. Learn machine-learning tools when the problem calls for them, and treat deep-learning frameworks as a further specialization rather than a universal starting requirement.
What is the simplest first project with these tools?
Use a small CSV file to answer one clear question. Load and inspect it with pandas, clean a few obvious issues, calculate a summary, and make a chart in Matplotlib. Once you can explain what the analysis shows, decide whether a predictive model would add anything.
Conclusion: learn a small stack, then follow the question
For a broad introduction to Python data science, start with Python fundamentals and Jupyter, then learn practical NumPy and pandas skills, add Matplotlib for exploration, and move to scikit-learn when you have a meaningful modeling task. Add SciPy or other specialist libraries only when the work gives you a reason.
The goal is not to know the longest list of package names. It is to understand how to use a manageable set of tools to inspect data, prepare it, communicate what you find, and choose a sensible next step.
Sources and further reading
- Python Data Science Handbook — publisher material describing the Python data-science stack.
- Python for Data Science, Chapter 3: Python Data Science Libraries — publisher material on NumPy, pandas, and scikit-learn.
- Streamlining Your Research Laboratory with Python, Chapter 9 — publisher material on data analysis, visualization, and scientific Python tools.
- The Python Tutorial and Virtual Environments and Packages — official Python documentation.