Python for Data Science: A Beginner’s Roadmap
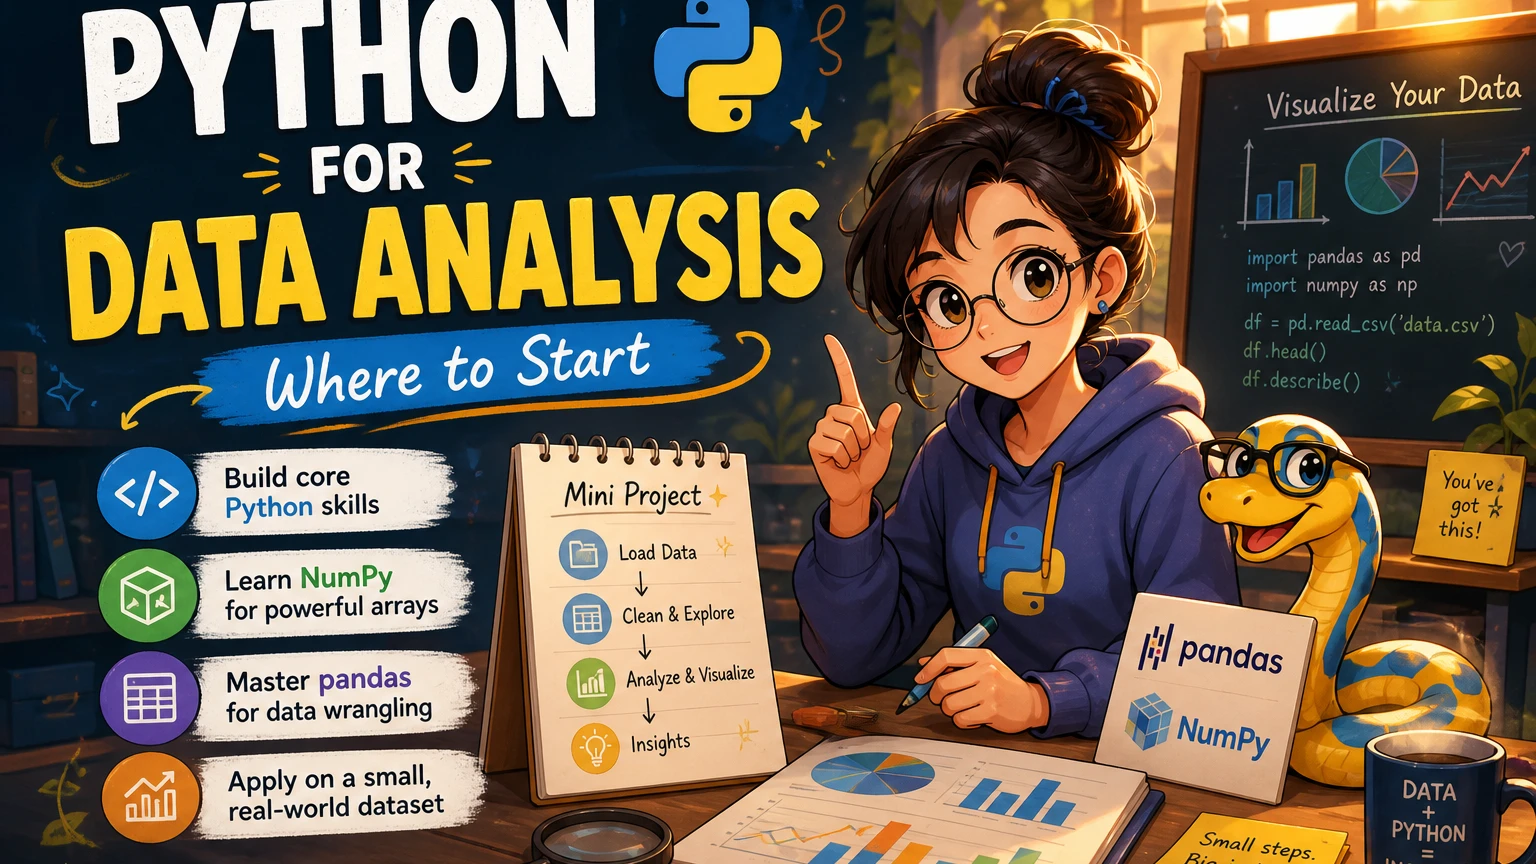
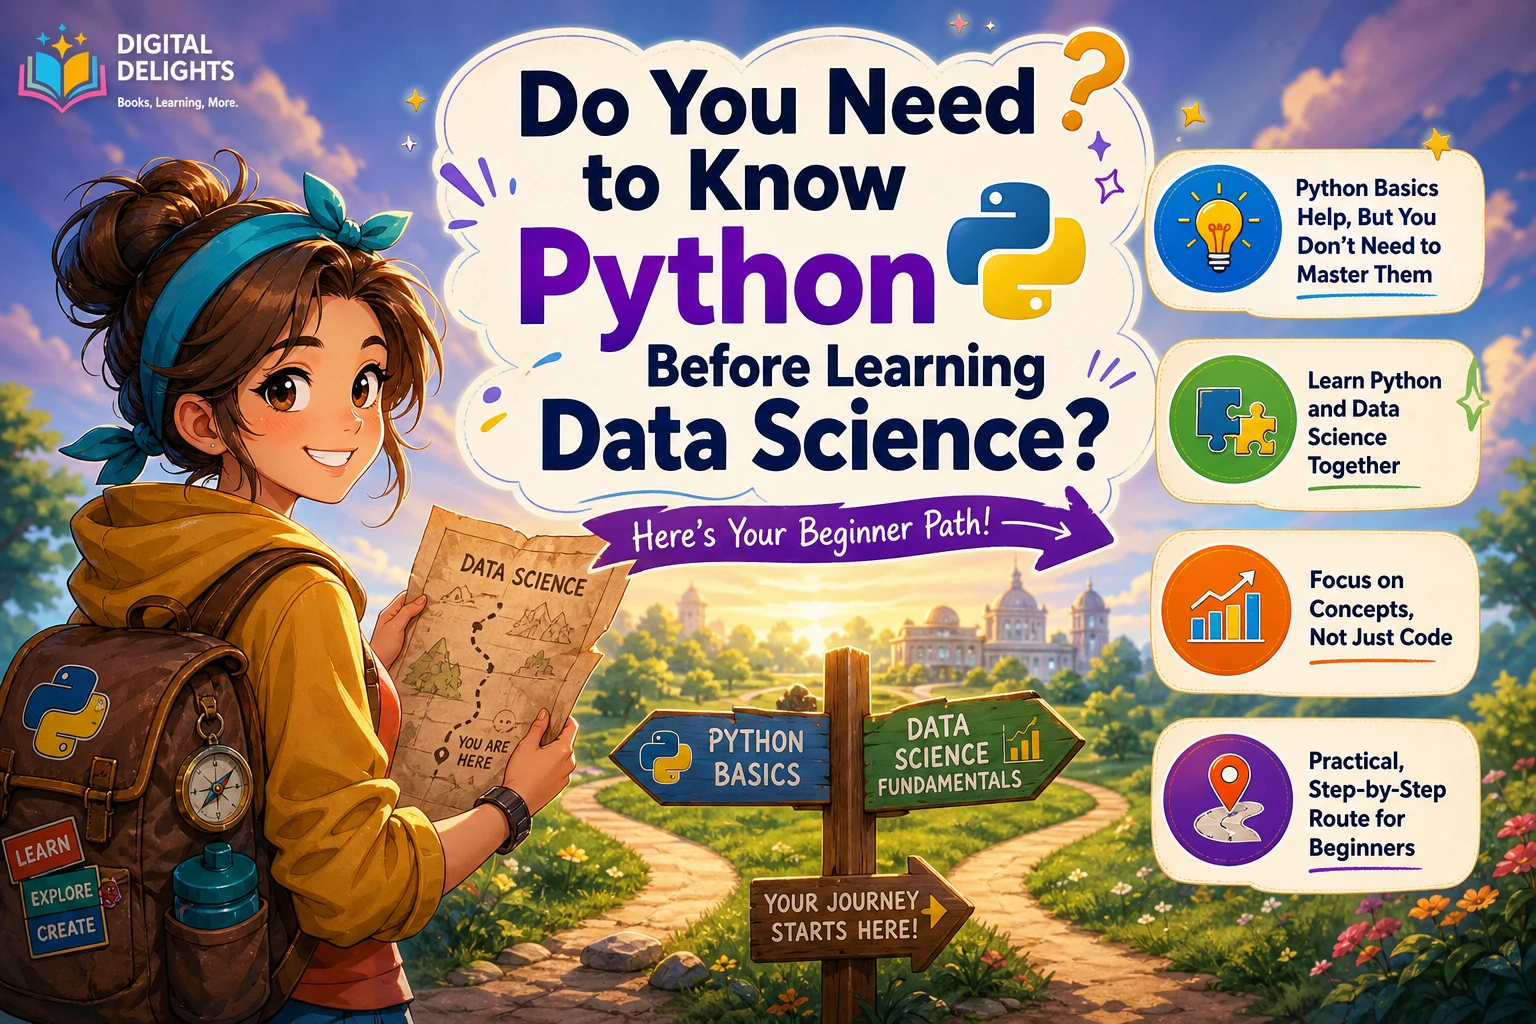
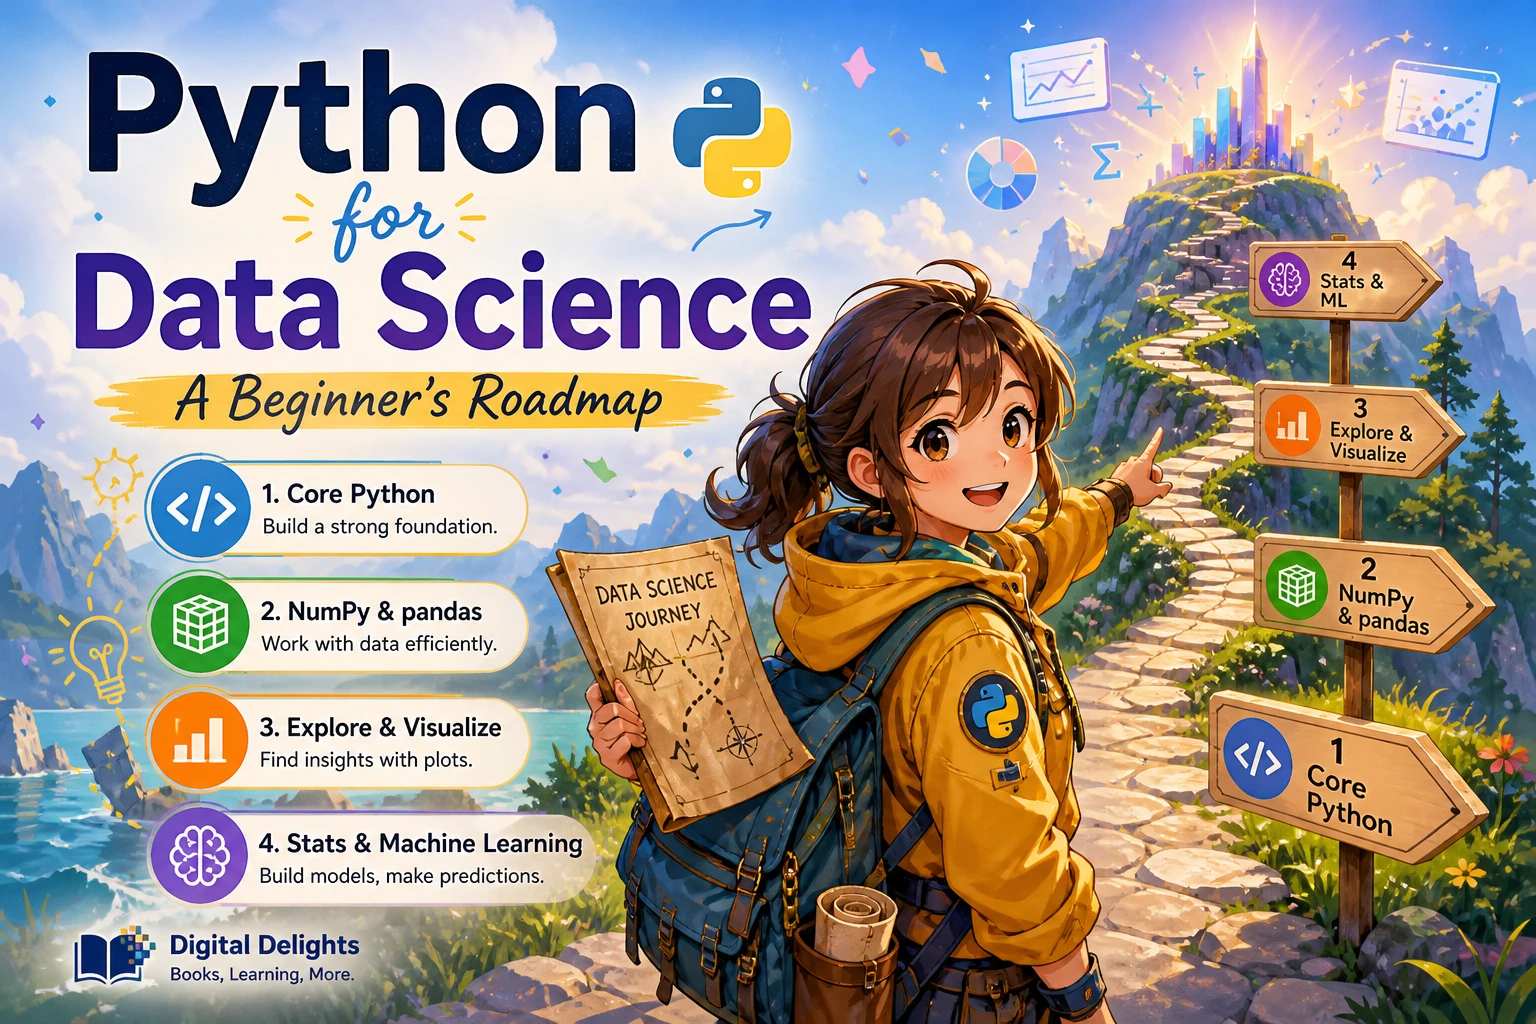
Getting started with data science in Python can feel like a choice between learning a programming language, installing a stack of tools, and studying statistics all at once. A more manageable approach is to learn the essentials in stages: first enough Python to write and understand small programs, then tools for arrays and tables, followed by data cleaning, exploration, visualization, and introductory modeling.
This is a practical roadmap, not a required curriculum. You can adjust the pace and revisit earlier steps as your projects demand. The goal is to build a useful habit: take a question, work with data that can help answer it, and explain what you found.
The Python for data science roadmap at a glance
- Learn core Python: variables, collections, conditions, loops, functions, and files.
- Set up a simple workspace: use scripts for reusable programs and notebooks for exploratory work; keep project packages isolated.
- Meet the data tools: learn NumPy arrays and pandas tables when you have a reason to use them.
- Explore and communicate: inspect, clean, summarize, and visualize a dataset.
- Build toward statistics and modeling: study relevant concepts as questions call for them, then try a simple model.
- Complete a small project: use the steps together and write a short account of the result and its limits.
A similar progression—from Python fundamentals and data structures to NumPy, pandas, data preparation, visualization, and more advanced analysis—appears in the contents of O’Reilly’s Python for Data Analysis. Treat that sequence as a useful reference, not proof that every learner must follow one fixed order.
Step 1: Learn the Python you will use every day
You do not need to master every feature of Python before working with data. Start with the basics that let you read, change, and organize information:
- Values and variables: strings, integers, floating-point numbers, booleans, and assigning values names.
- Collections: lists and dictionaries, including how to access, add, and update items.
- Conditions and loops: make decisions with
ifstatements and repeat work withforloops. - Functions: group repeated steps into named pieces of code that can take inputs and return results.
- Files and errors: read a simple data file, recognize common errors, and use messages to investigate what went wrong.
For example, a list of values can be summarized with a loop before you learn a data library:
measurements = [12, 15, 11, 18]
total = 0

for value in measurements:
    total += value

average = total / len(measurements)
print(average)
Being able to follow this small program helps when you later encounter similar operations on much larger datasets. The point is not to avoid libraries; it is to understand the kind of work they make easier.
If you want a structured introduction before moving into data tools, the catalog’s step-by-step Python programming guide for beginners covers foundational topics such as variables, control flow, data structures, functions, files, and exceptions.
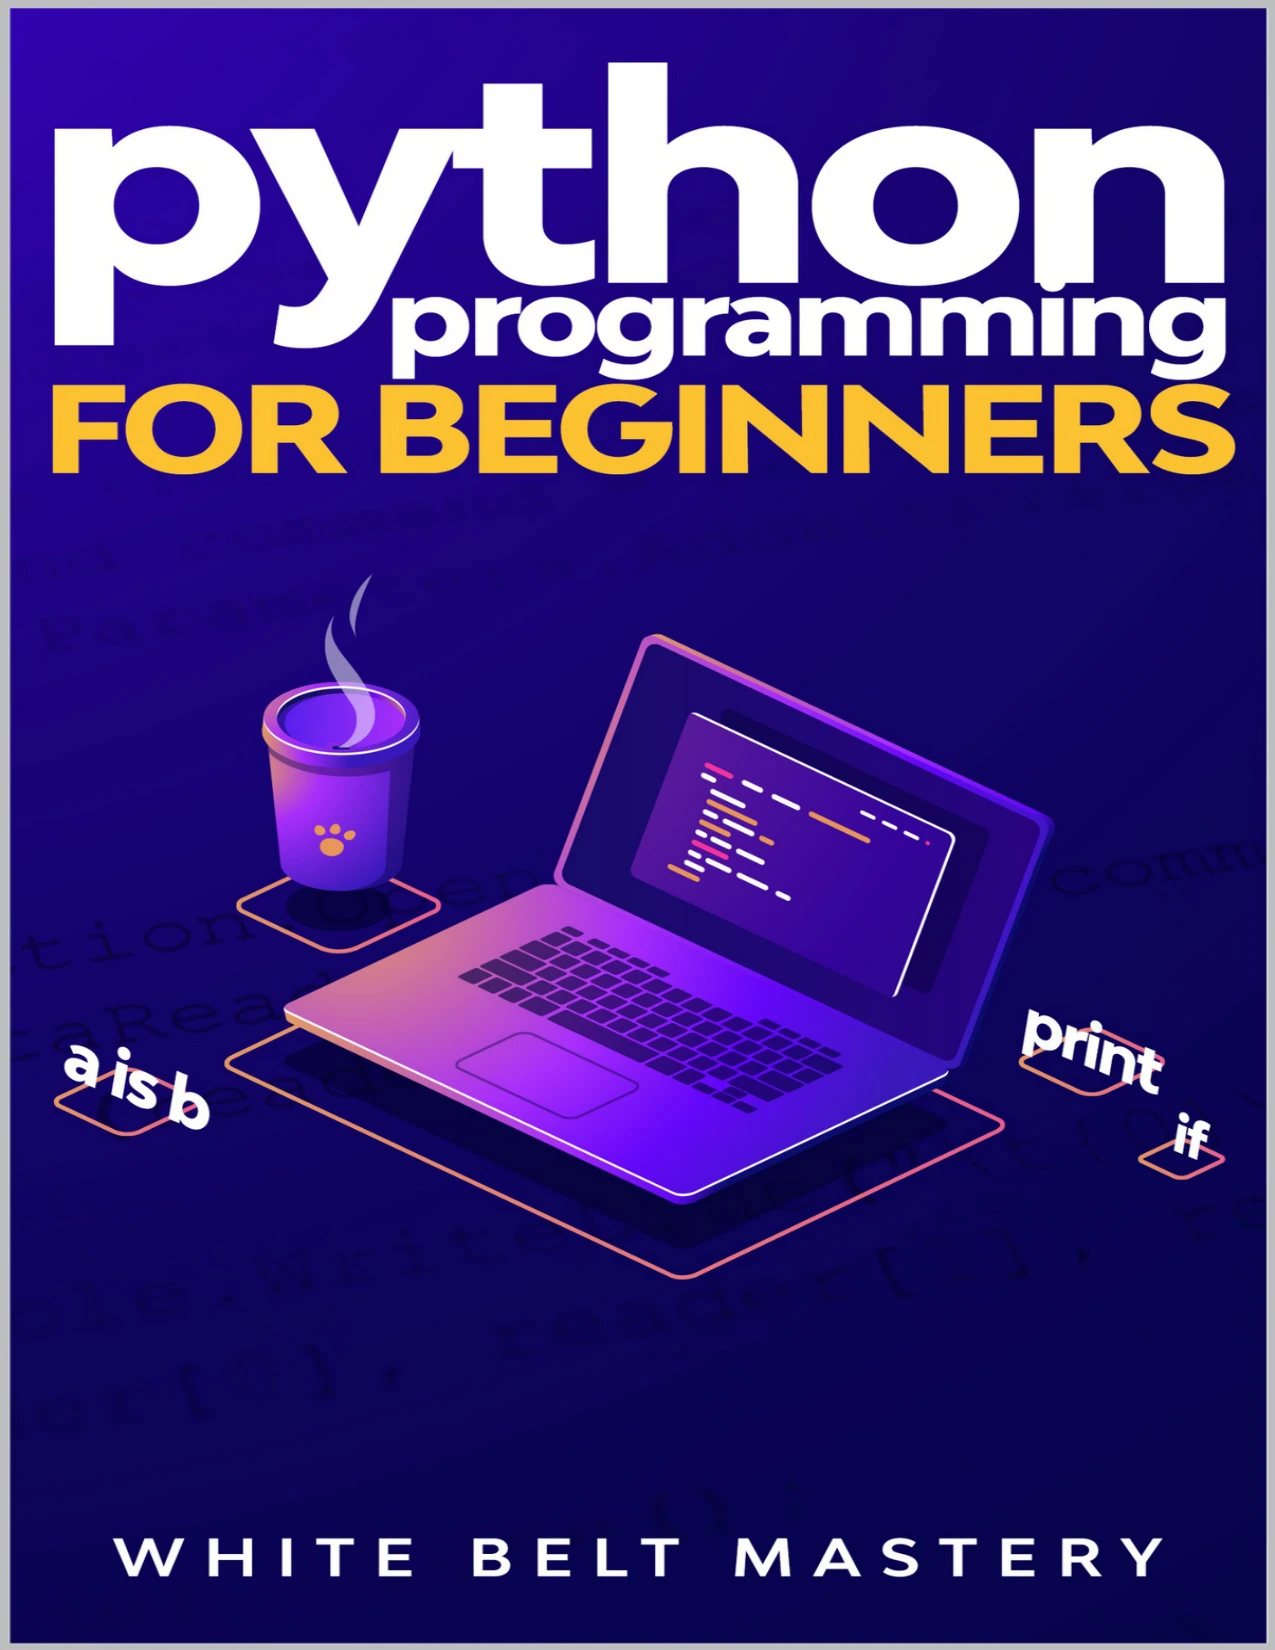
Beginners looking for ordered coverage of variables, control flow, data structures, functions, and files.
Step 2: Set up a workspace you can understand
Python data work commonly involves both scripts and notebooks. You do not have to choose one forever; they are useful for different kinds of work.
- Scripts are Python files you run as programs. They are useful for repeatable tasks and for practicing how code runs from beginning to end.
- Notebooks let you run code in sections and place notes or results alongside it. They can be convenient for trying ideas and examining data as you go.
For a first project, use whichever format makes it easiest to run code and understand the output. As the work becomes more repeatable, consider moving the steps you want to reuse into a script or functions.
Keep each project’s packages separate
Python’s built-in venv module creates an isolated environment for a project’s interpreter and packages. This can help prevent one project’s package changes from affecting another. The official documentation shows the command pattern python -m venv; the environment name and activation steps can vary by operating system and shell, so follow the instructions for your setup. See the Python documentation for virtual environments.
Install only the tools you need for a project, and check the current installation and compatibility guidance for each library. The supplied sources do not verify compatibility across the current data-science package ecosystem, so do not assume that every package supports every new Python release.
Step 3: Learn NumPy and pandas through actual tasks
Once basic Python feels familiar, begin using the tools that make common data operations more convenient.
NumPy: arrays and numerical operations
NumPy provides arrays and tools for working with numerical data. Learn the basics by creating an array, selecting values, checking its shape, and carrying out a simple calculation. You do not need to begin with advanced numerical techniques; focus on understanding what an array contains and how operations apply to it.
pandas: tables and labeled data
pandas is commonly used to work with table-shaped data. A pandas DataFrame has rows and named columns, making it practical to inspect records, select fields, filter rows, group values, and work with missing entries.
A useful learning exercise is to load a small CSV file and answer simple questions: How many rows are there? Which columns are present? Are any values missing? What is the average or count for a group? Learn each operation when it helps you answer one of those questions, rather than trying to memorize a long list of methods.
Step 4: Explore, clean, and visualize a dataset
Before drawing conclusions from data, find out what is in it. A repeatable beginner workflow is:
- Load: read the file and confirm that it opened as expected.
- Inspect: look at a few rows, column names, data types, and missing-value counts.
- Clean: address issues relevant to your question, such as missing values, inconsistent labels, or dates stored as text.
- Summarize: calculate a few meaningful counts, totals, or averages.
- Visualize: choose a chart that makes the comparison or pattern easier to see.
- Explain: state what the result suggests, and note what it cannot tell you.
For example, with a CSV that contains columns named date and category, an initial check might look like this:
import pandas as pd

df = pd.read_csv("records.csv")
print(df.head())
print(df.info())
print(df.isna().sum())

df["date"] = pd.to_datetime(df["date"], errors="coerce")
counts = df.groupby("category").size().sort_values(ascending=False)
print(counts)
This example assumes those column names exist; adapt them to the file you choose. Converting dates with errors="coerce" turns unrecognized date values into missing values, which you should inspect rather than ignore.
For a chart, you could use a plotting library to display the category counts. A chart is not automatically an insight: label it clearly, check that the comparison is fair, and describe what you observe without implying more than the data supports.
Data preparation is worth learning as a subject in its own right. A practical guide to data preprocessing in Python covers topics including cleaning, integration, reduction, transformation, and working with tools such as NumPy and pandas.
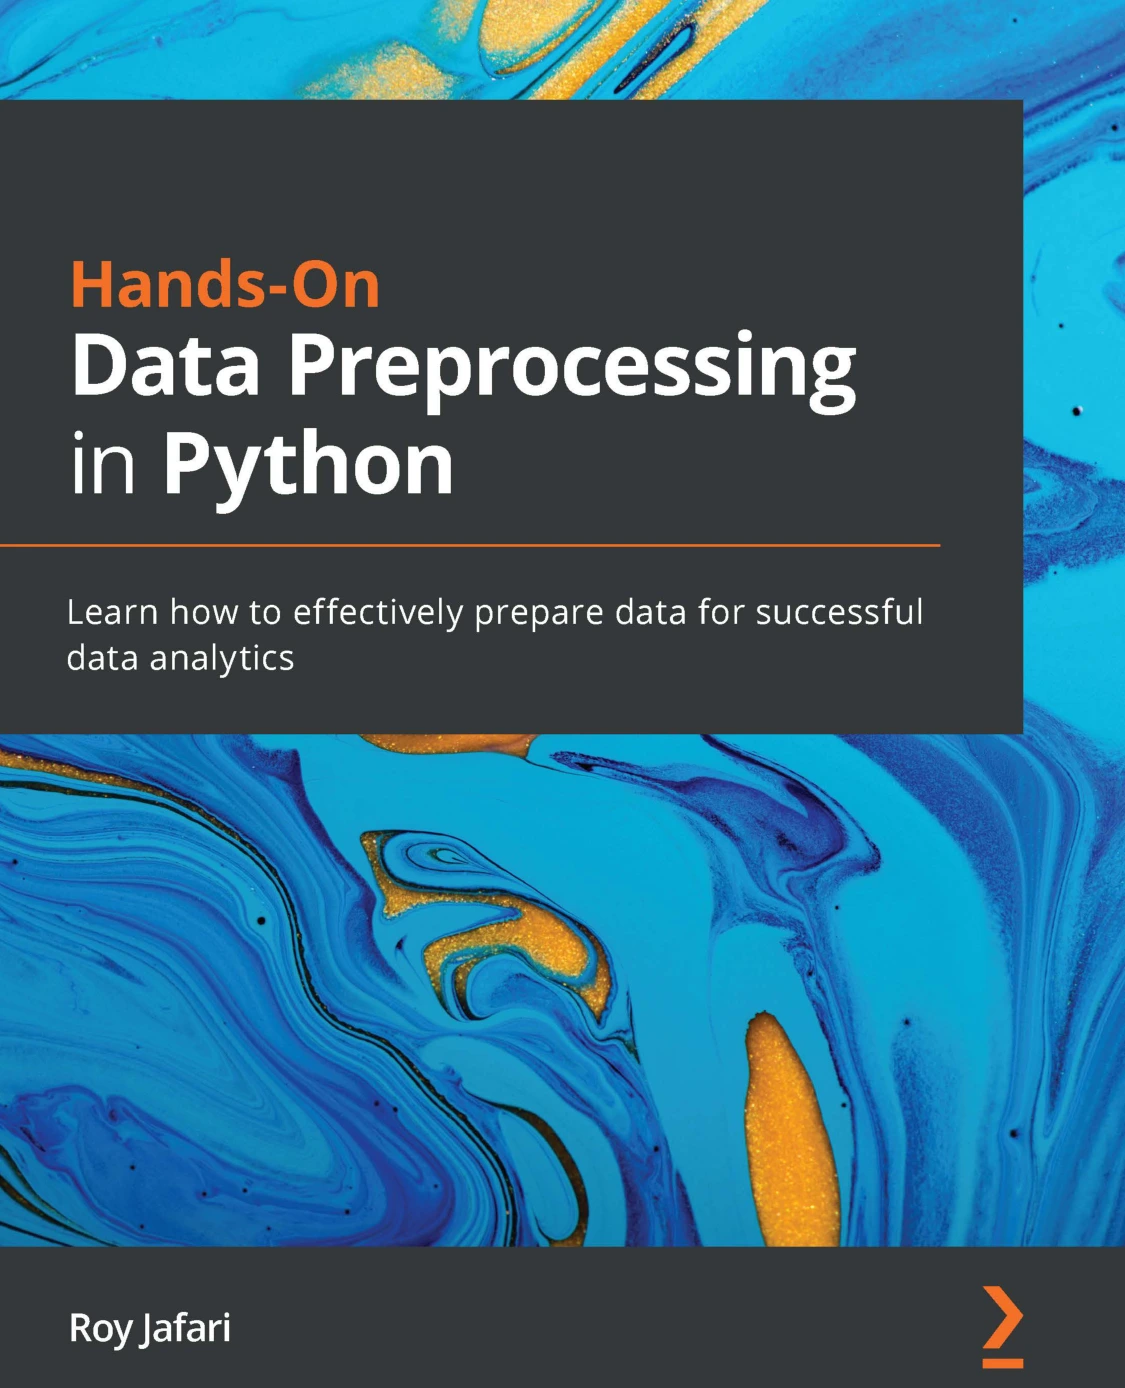
By Roy Jafari
Learners ready to explore cleaning, integration, reduction, and transformation with Python.
Step 5: Add statistics and introductory machine learning
Statistics helps you reason about summaries, variation, comparisons, and uncertainty. You can learn the relevant ideas alongside projects: when a question involves comparing groups, for example, ask what each group contains and whether the data supports the comparison before reaching for a model.
Machine learning is a later step, not a prerequisite for exploring a dataset. Before fitting a model, be able to describe the data, identify the outcome you want to predict, and explain how you will judge a result. Start with a basic model and a clearly defined question; avoid treating a model’s output as an explanation by itself.
If you are ready for an introductory overview, the catalog’s beginner-focused Python data science resource covering NumPy, pandas, visualization, and machine-learning basics may help you explore those topics together. Its listed coverage includes practical examples and exercises; use it as a learning resource rather than as a promise of a particular outcome or timetable.
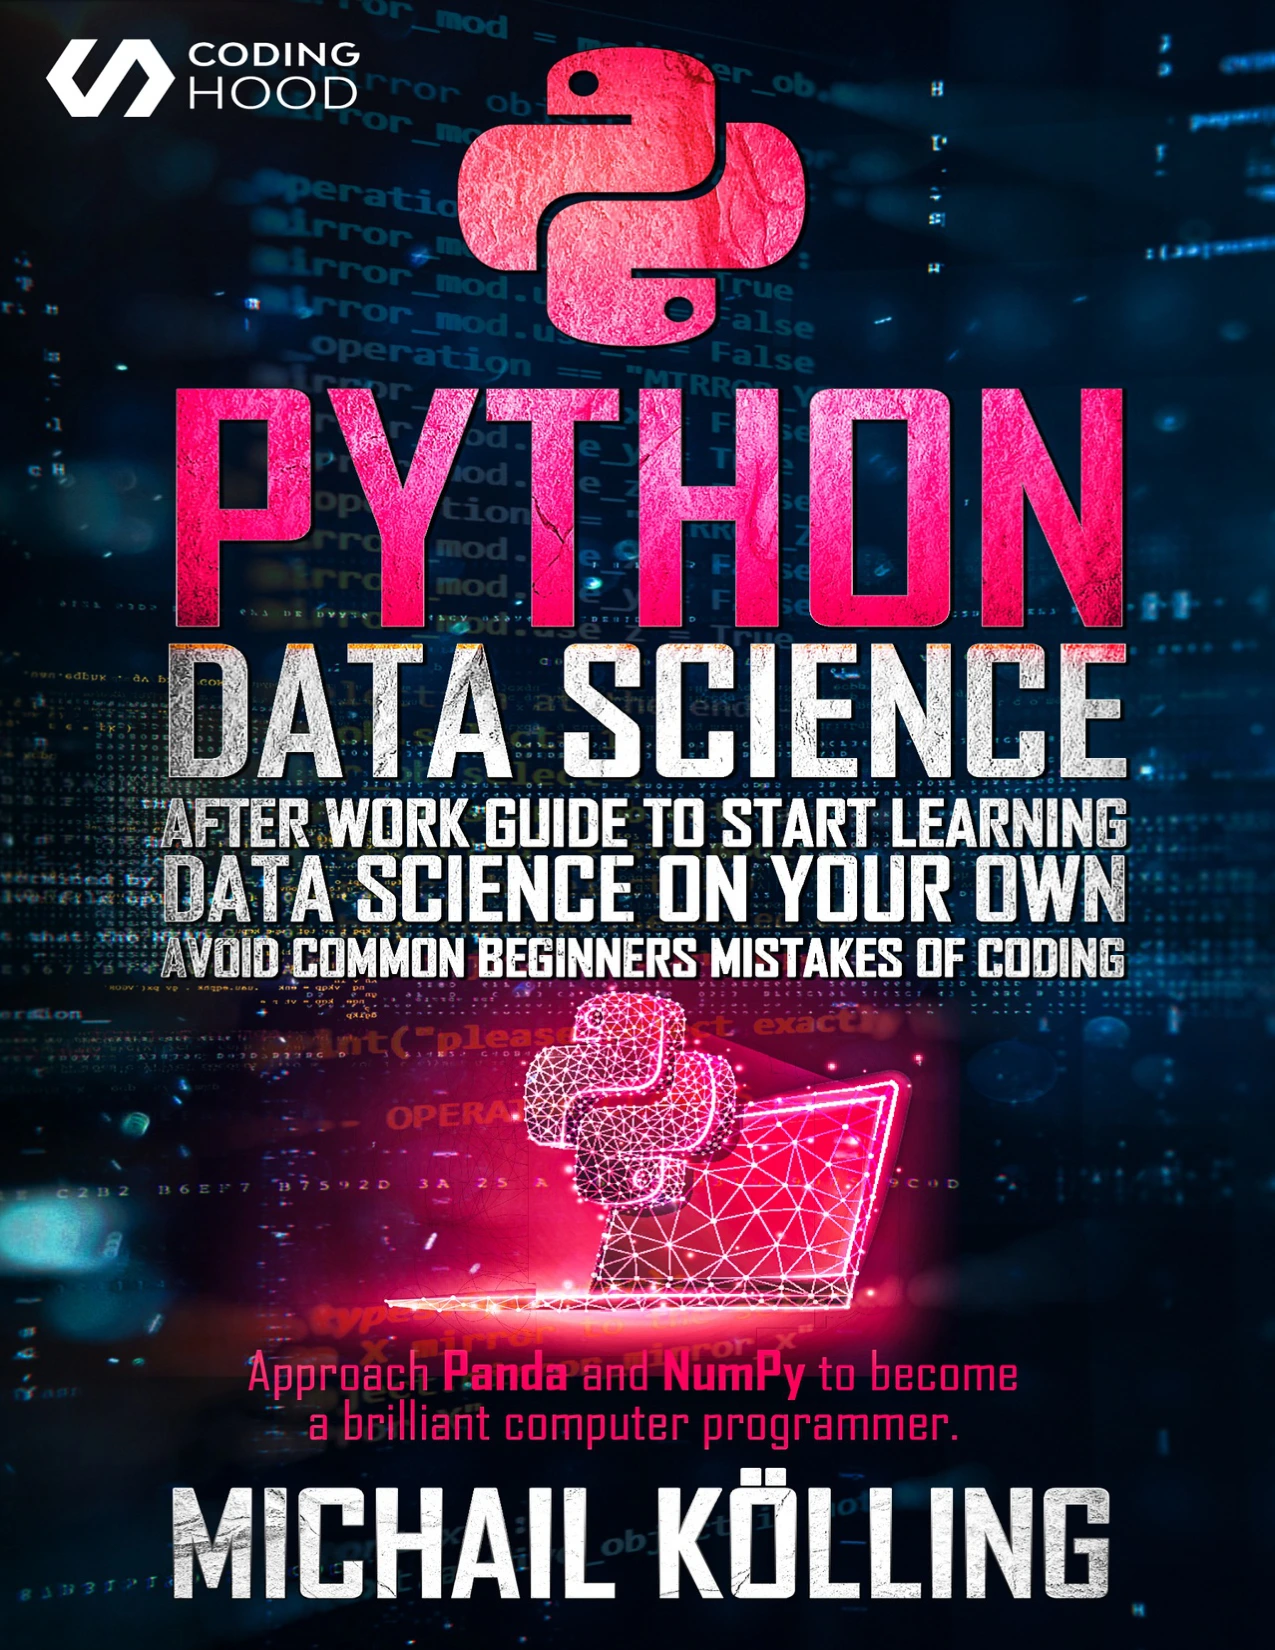
Self-directed beginners seeking introductory coverage of NumPy, Pandas, visualization, and machine-learning basics.
A beginner project that connects the steps
Choose a small, accessible dataset that interests you and write down one question before you begin. Examples might include comparing counts across categories, examining how a measurement changes over time, or finding which items appear most often. Use data that you are allowed to access and share.
Work through this checklist:
- Write the question in one sentence.
- Record where the data came from and what its columns mean.
- Load the file and inspect several rows.
- Check for missing values, unexpected data types, and inconsistent labels.
- Summarize only the fields that help answer your question.
- Create one clear chart or table.
- Write a short conclusion, including one limitation or uncertainty.
For more guided coding practice before or alongside a project, Python Bookcamp: Exercises and Projects is cataloged as a hands-on resource covering Python fundamentals, case studies, exercises, and projects. Its focus can suit learners who want to spend time writing and revising code, not just reading explanations.
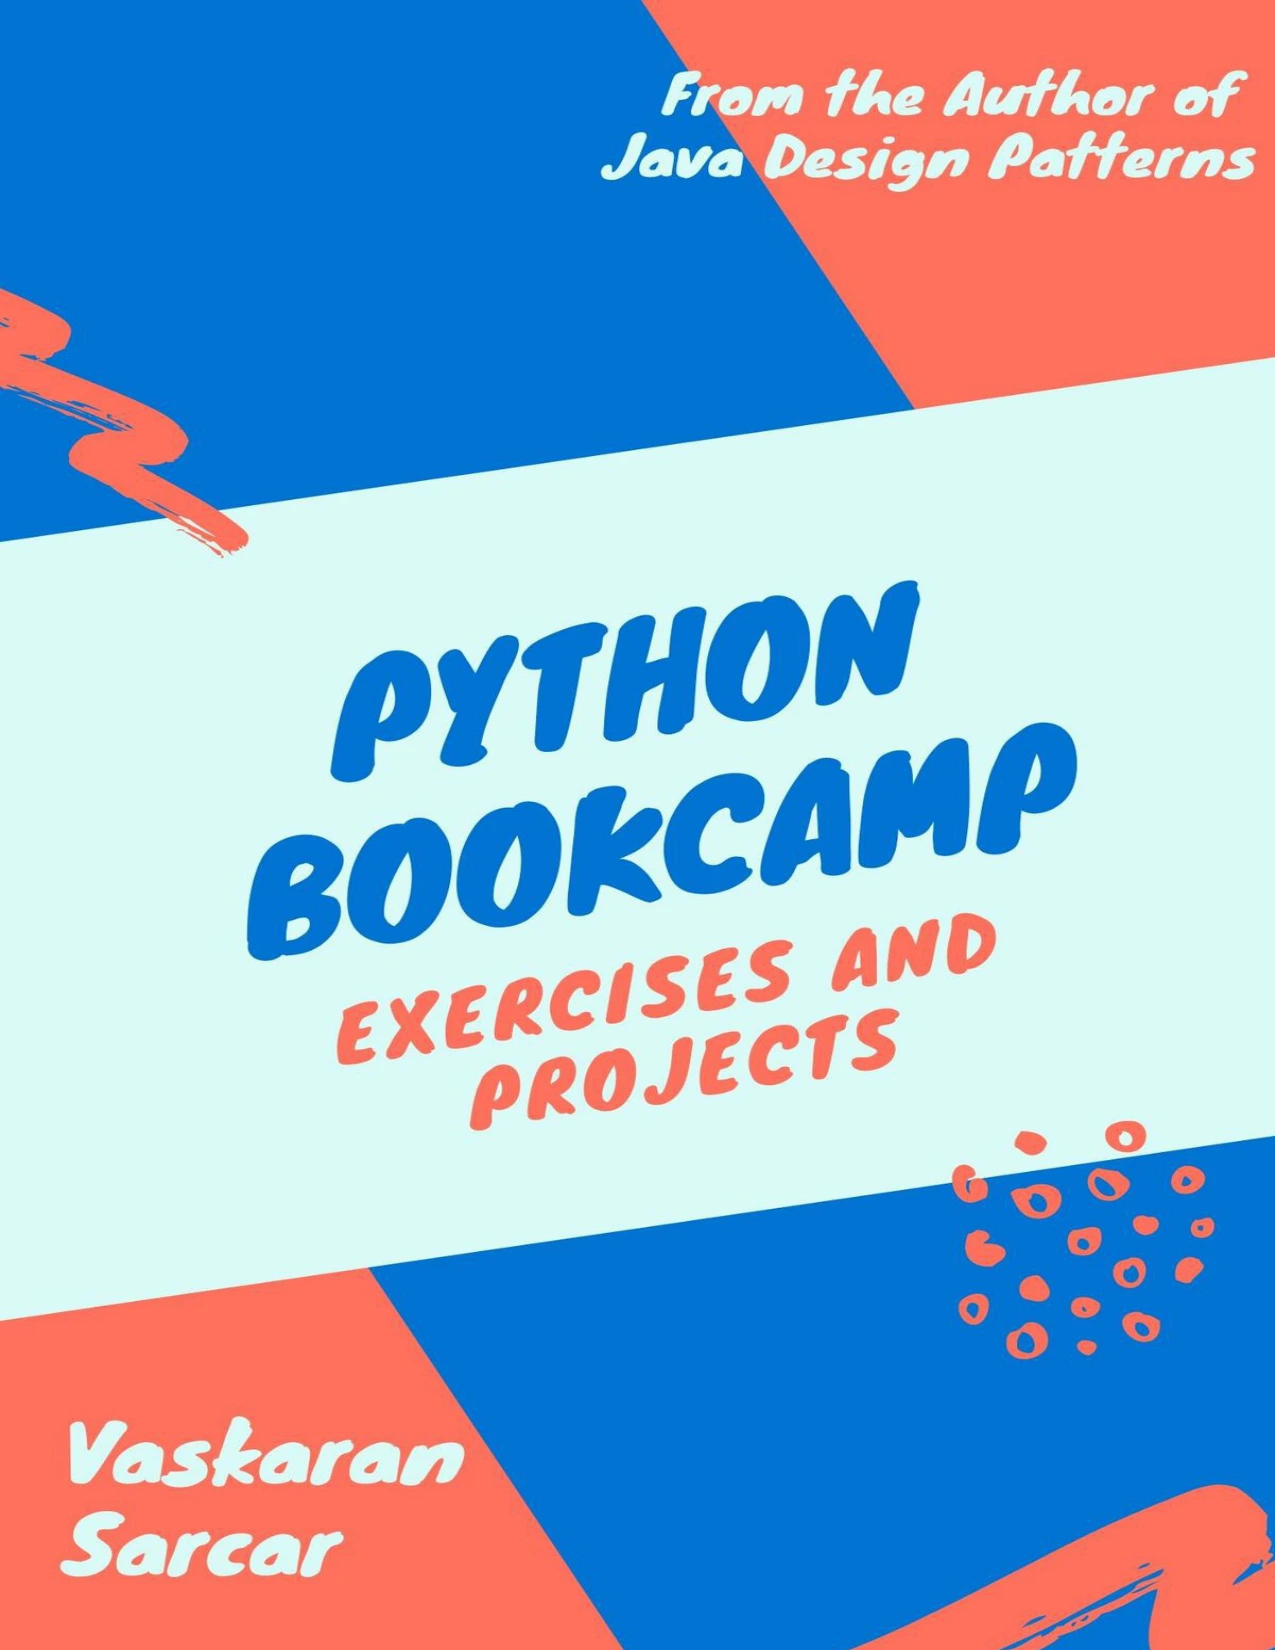
Python Bookcamp: Exercises and Projects
Learners who want exercises, case studies, and projects to apply Python concepts.
Common mistakes to avoid
- Skipping Python fundamentals. If lists, loops, and functions are still unfamiliar, pause to practice them before adding several libraries at once.
- Copying tutorials without changing anything. After following an example, alter a value, use a different column, or answer a new question to check whether you understand the steps.
- Starting with a project that is too large. Choose a small dataset and one question. Expand the project only after you have a working first result.
- Cleaning data without a reason. Make changes that serve the question, and keep track of what you changed.
- Jumping to machine learning too soon. First understand the data and the problem. A model cannot make unclear data or an unclear question meaningful by itself.
- Expecting a fixed learning timeline. Progress depends on your starting point, practice, and goals. Use completed tasks—not an arbitrary deadline—to decide when to move forward.
How to choose a learning resource
Choose the next resource based on the work you need to do, not simply on how advanced its title sounds.
| Your current need | What to look for | Catalog example |
|---|---|---|
| Build a Python foundation | Ordered explanations of variables, control flow, functions, and data structures | Step-by-step Python programming for beginners |
| Practice by writing code | Exercises, case studies, and small projects that let you apply concepts | Python Bookcamp: Exercises and Projects |
| Connect Python with data work | Introductory treatment of data tools, exploration, and practical examples | Beginner-oriented Python data science guide |
Before choosing, check the resource’s listed contents and intended level against your next learning goal. One book does not need to cover everything: a fundamentals guide, practice material, and a data-focused introduction can serve different stages.
Frequently asked questions
Do I need prior programming experience to learn Python for data science?
No prior programming experience is required to begin. Start with basic Python concepts and practice reading and changing small programs before taking on more involved data work.
How much math should I know before starting?
You can begin learning Python and exploring datasets without first completing a large mathematics curriculum. Build the statistical and mathematical ideas that your questions require as you progress. The supplied research does not establish one universal math prerequisite.
Should I start with notebooks or scripts?
Either can work. Notebooks are convenient for interactive exploration and combining code with notes; scripts are useful for repeatable programs. Try both as needed, and choose the format that makes your current task easiest to understand.
When should I learn pandas?
Learn enough core Python to understand variables, collections, loops, and functions, then try pandas when you begin working with tables. You can learn its operations gradually by applying them to a real dataset.
When should I start machine learning?
After you can load, inspect, clean, summarize, and explain a dataset. Then choose a small prediction question and learn a basic model alongside how to evaluate its results. Machine learning is one direction within data science, not the first step for every project.
Conclusion: build one small result at a time
A useful beginner path is Python fundamentals, a workable environment, NumPy and pandas, data exploration and visualization, and then statistics or introductory modeling as your projects call for them. You do not have to learn every tool before beginning. Choose a modest question, work through the data carefully, and explain the result in your own words. That end-to-end practice gives each new concept a clear purpose.
Sources and further reading
- O’Reilly: Python for Data Analysis, 3rd Edition — reference for a progression through Python and common data-analysis topics.
- Python documentation:
venv— documentation for creating isolated Python environments. - Python.org downloads — check current releases when setting up a project.