How to Debug Python Code as a Beginner
A Python program can stop with an error, or it can run and quietly produce the wrong answer. In either case, debugging is a process: reproduce the problem, read the clues, narrow down where things go wrong, make one change, and test the result.
Start with the error message rather than changing code at random. A traceback can point you toward a failing line; when there is no error message, compare what the program actually does with what you expected it to do. This guide walks through both situations, with beginner-friendly ways to use print(), Python’s built-in debugger, and logging.
First, identify what kind of problem you have
Different problems call for different clues. A program that cannot be parsed is not debugged in quite the same way as a program that runs but makes the wrong calculation.
- Syntax error: Python cannot parse the code as written. A missing colon, unmatched parenthesis, or misspelled keyword can cause this kind of error.
- Runtime exception: Python begins running the program, then encounters a problem, such as trying to convert unsuitable text to a number.
- Logic error: The program runs, but its result or behavior is incorrect. Python may show no error at all.
Python’s tutorial distinguishes syntax errors, which are detected while parsing, from exceptions that occur during execution. The official errors and exceptions tutorial explains both and describes how tracebacks report unhandled exceptions.
How to read a Python traceback
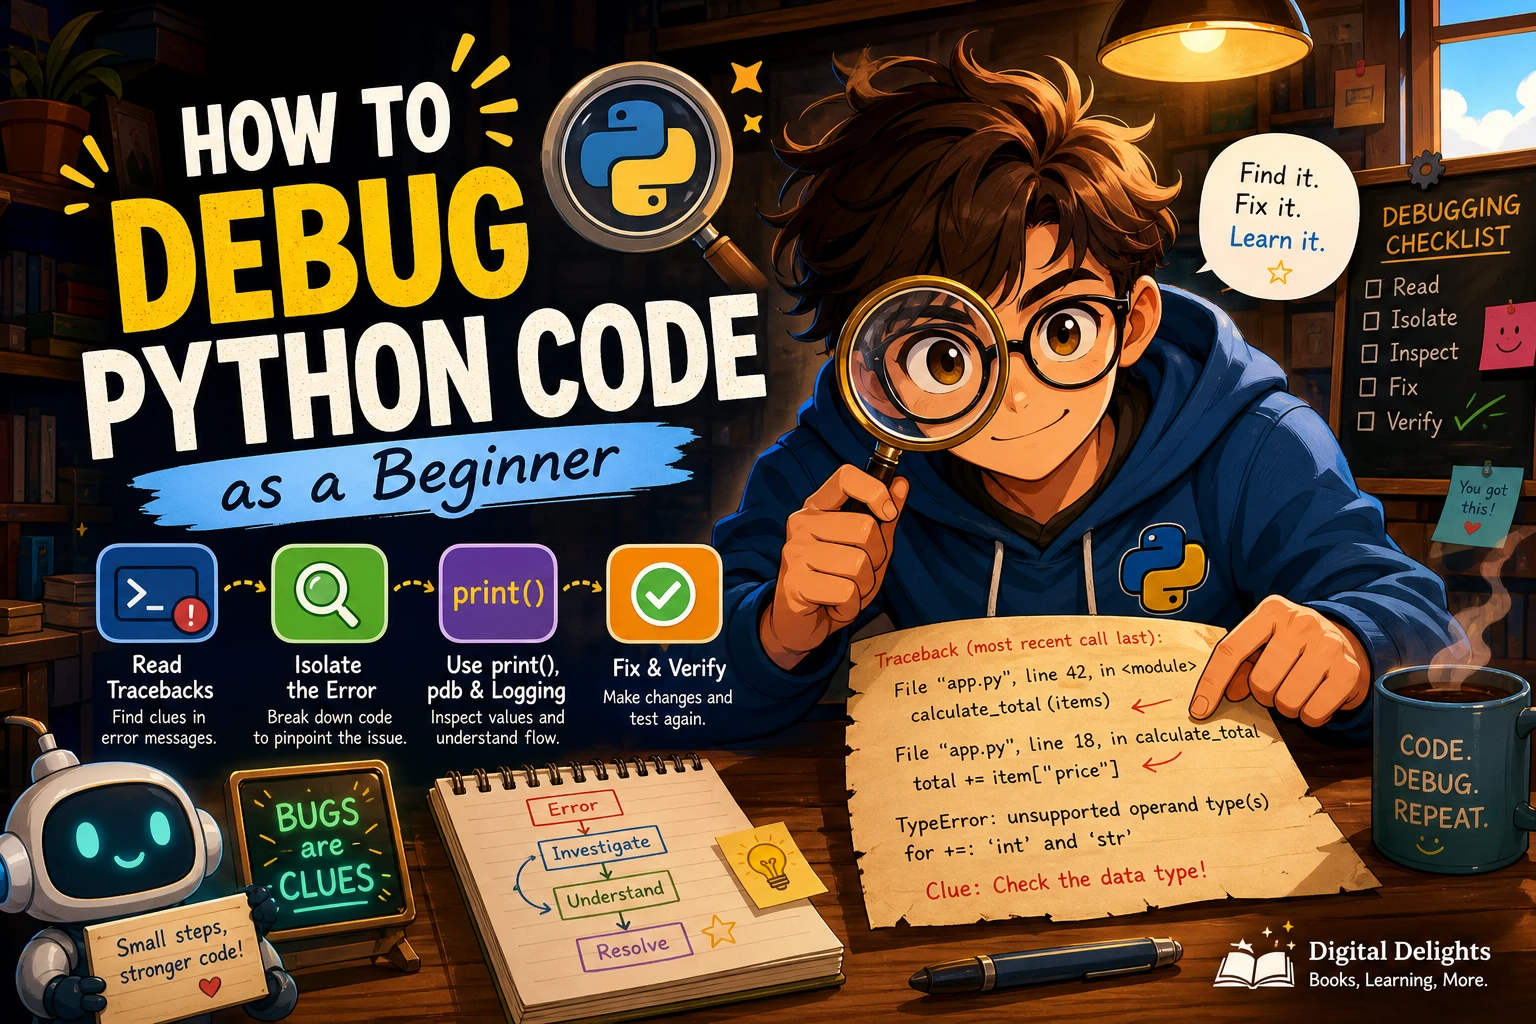
A traceback is Python’s account of the calls that led to an unhandled exception. It usually contains file names, line numbers, code context, and a final line naming the exception and giving a message. Read that final line first to learn what kind of exception occurred, then inspect the relevant lines above it to find where it arose.
- Read the exception name and message. For example,
TypeErrorsignals a type-related problem; the message adds detail about the operation that failed. - Find the relevant file and line. Look for the code location identified in the traceback. If several functions appear, inspect the calls leading to the failing operation too.
- Check the values used on that line. Ask what types and values the expression expects, and whether the program supplied them.
- Trace the values back if needed. A line that fails may be where the problem becomes visible, not where an incorrect value first entered the program.
For instance, if the final line says ValueError and mentions converting text to an integer, check the actual text passed to int(). Do not assume that the line number alone explains why that value was unexpected.
A beginner-friendly process for debugging Python code
1. Reproduce the problem
Run the program again with the same input or actions that caused the issue. Write down what you expected and what happened instead. If you cannot reproduce the problem reliably, it will be harder to tell whether a change fixed it.
2. Reduce the problem if you can
Try the smallest input that still produces the issue. In a larger program, temporarily focus on the function or section where the unexpected behavior appears. A smaller example gives you fewer places to investigate.
3. Check assumptions and values
Ask concrete questions: Is this variable the value I expect? Is it a string or a number? Does this list contain the item I think it does? For a small script, a brief print() can answer those questions. Check values near the point where the result first becomes surprising—not just at the end.
4. Make one change at a time
Change the line or assumption you have reason to suspect, then run the same test again. If you alter several unrelated parts at once, a better result will not tell you which change mattered—and a new problem may be harder to trace.
5. Confirm the fix
Run the original case again and check the output. Also try a normal input and, where relevant, an edge case such as an empty list or a value at a boundary. A fix is not confirmed simply because the error message disappeared.
Choose a debugging tool that fits the problem
Use print() for a quick check
For a short script or a single uncertain value, printing a variable can be the fastest way to see what the program is doing. Label the output so you can recognize it, then remove or replace temporary diagnostic prints when they are no longer useful.
total = price * quantity
print("price:", price, "quantity:", quantity, "total:", total)
This is a simple check, not a substitute for understanding the calculation. If the values look right but the result is still wrong, examine the formula and the expectations around it.
Use breakpoint() or pdb to inspect execution
When you need to pause a program and examine what happens step by step, Python’s built-in debugger is a better fit. Put breakpoint() at a point you want to inspect, or start a script with python -m pdb your_script.py. The debugger can pause at breakpoints, step through code, inspect stack frames, and evaluate expressions in the current frame. See the official Python debugger reference for command details; available features can depend on the Python version.
def calculate_total(price, quantity):
    breakpoint()
    return price * quantity

print(calculate_total(4, 3))
At the pause, inspect price and quantity, then step through the function to see what it returns. The exact interface depends on how you run Python, but the debugging idea is the same: stop at a useful point, inspect the state, and follow execution.
Use logging when you need diagnostic records
For a longer-running script or a program with several stages, logging can record useful events as the program runs. Python’s logging guide describes print() as suitable for ordinary command-line output and logger messages as a way to record diagnostic information. The DEBUG level is intended for detailed information useful when diagnosing problems. Read the official Logging HOWTO when you are ready to configure it.
These tools complement one another: use a print for a quick check, a debugger when you need to inspect execution interactively, and logging when you need a record of events across a run.
Worked example: why does this function return the wrong total?
Imagine a function intended to add up the numbers in a list:
def total_cost(prices):
    total = 0
    for price in prices:
        total = price
    return total

print(total_cost([4, 3, 2]))
The code runs, but it prints 2 instead of the expected total, 9. There is no exception to explain the result, so treat this as a logic error.
- Reproduce it with the small list
[4, 3, 2]. - Inspect the value of
totalafter each loop iteration. A temporary print shows that it becomes 4, then 3, then 2. - Compare that behavior with the goal: each price should be added to the running total, not replace it.
- Change the assignment, then run the same example again.
The corrected function is:
def total_cost(prices):
    total = 0
    for price in prices:
        total += price
    return total

print(total_cost([4, 3, 2]))  # 9
The useful clue was the value changing on each iteration. Watching a program’s state often makes a logic error clearer than staring at the final answer.
Common beginner debugging mistakes
- Skimming the traceback: Read the exception message and inspect the relevant code, rather than guessing from the first line you notice.
- Changing several things at once: Make a focused change so you can tell what affected the result.
- Hiding errors with broad exception handling: A catch-all handler that suppresses an error can conceal the information you need to diagnose it. Handle exceptions deliberately and preserve useful details.
- Checking only the final output: For logic bugs, inspect intermediate values to find where the result first diverges from what you expect.
- Stopping after one successful run: Retest the original case and consider other relevant inputs so the change does not only work for one example.
Frequently asked questions
What is a traceback in Python?
A traceback shows the sequence of calls associated with an unhandled exception, along with code locations and the exception’s final message. Use it to identify the failure and investigate the values and calls that led to it.
When should I use a debugger instead of print()?
Use print() when you only need to check a small number of values. Use a debugger when you need to pause execution, move through code step by step, or inspect the current program state and call frames. For a longer run that needs diagnostic records, consider logging.
How do I debug code that runs but gives the wrong answer?
Reproduce the wrong result with a small input, write down the expected result, and inspect intermediate values. Find the first point where the program’s behavior differs from your expectation, then change one thing and rerun the same test.
Keep learning with a structured Python resource
Debugging becomes more approachable as you learn the language’s core concepts and practise reading code. Python 101 by Michael Driscoll covers Python fundamentals as well as debugging with pdb, testing, and other practical topics. It may suit learners who want a broader reference alongside hands-on practice. You can also browse the Python learning resources catalog.
Learners seeking a Python fundamentals reference that also covers pdb, debugging, and testing.
Conclusion
When Python code behaves unexpectedly, resist the urge to change lines at random. Identify whether you have a syntax error, an exception, or a logic error; read the message and traceback when available; inspect relevant values; and test one focused change at a time. Use print(), pdb, or logging according to the kind of evidence you need. With each debugging pass, aim to understand not just what failed, but why.