

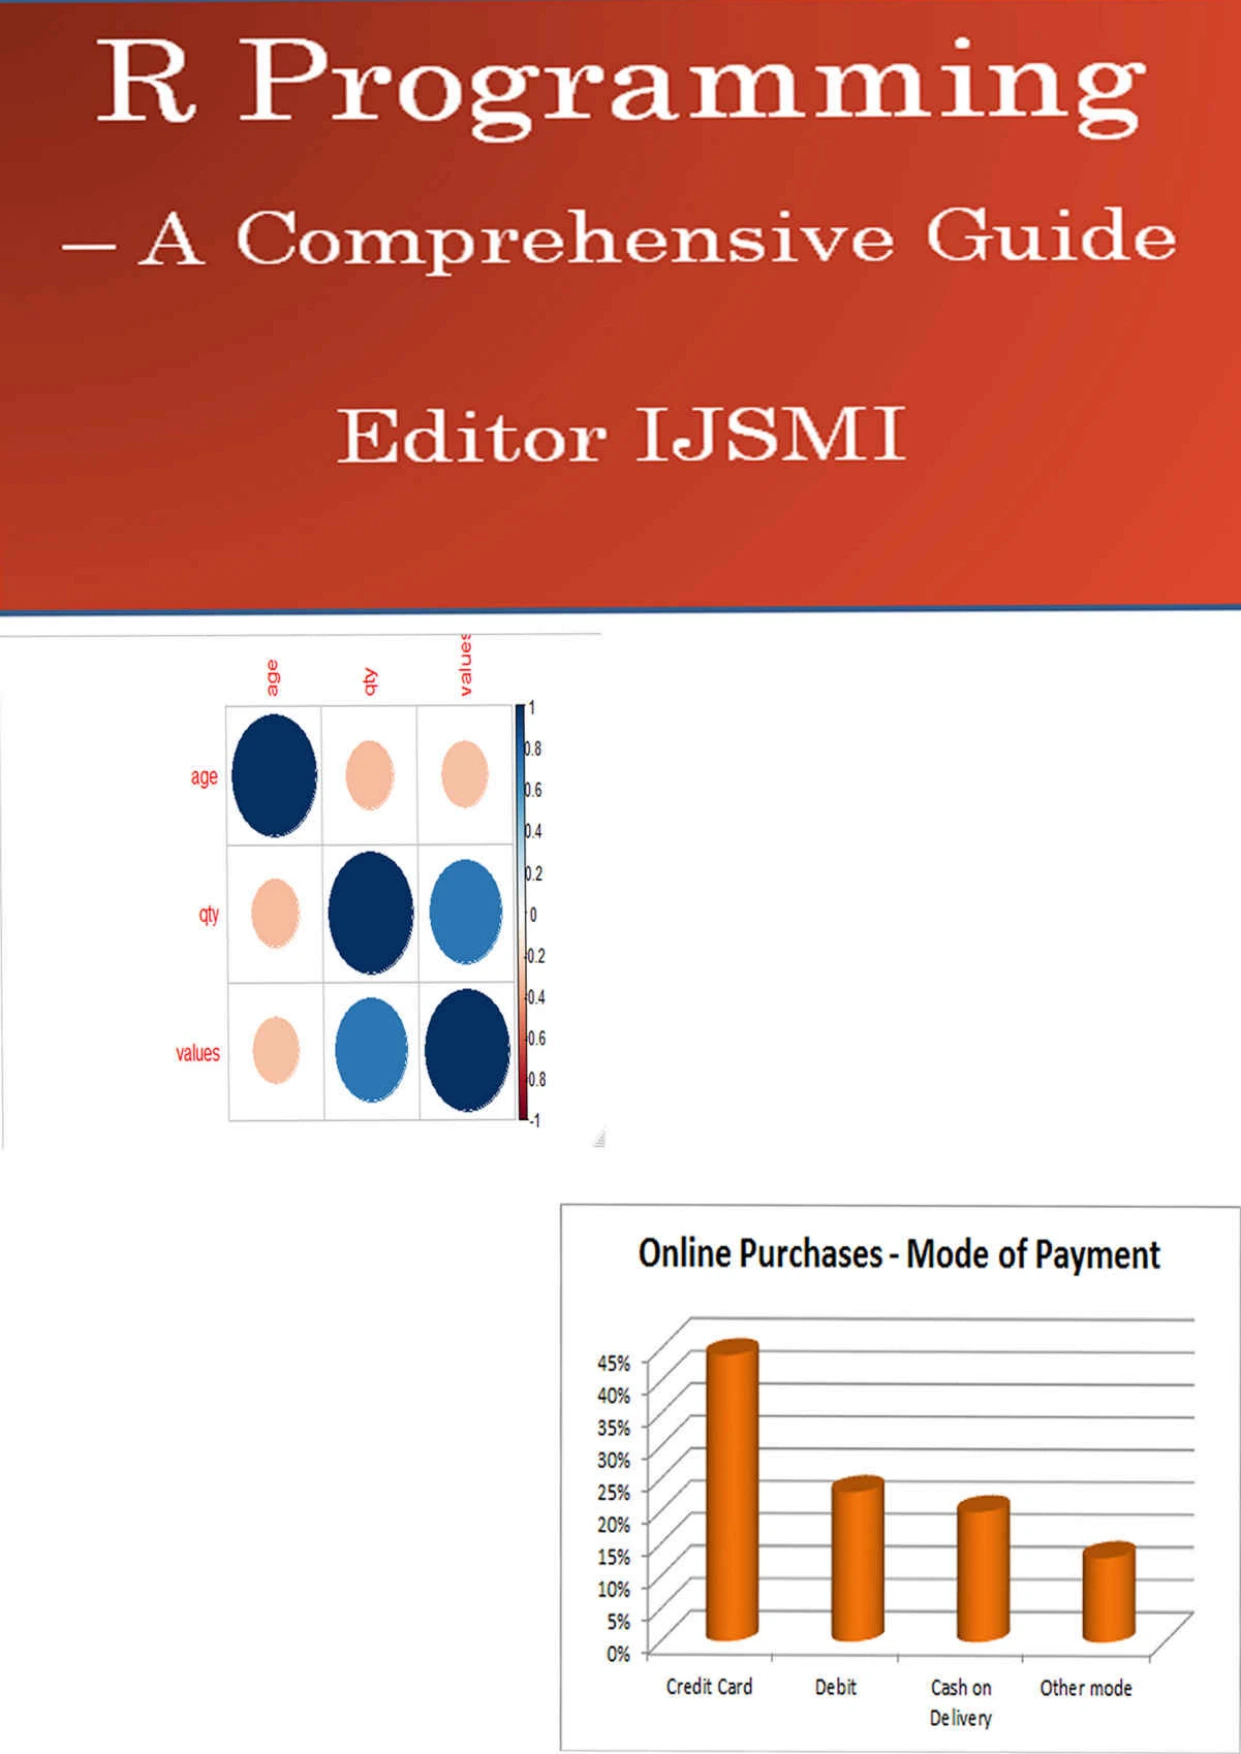
R Programming – a Comprehensive Guide: Software
Original price was: $5.00.$2.50Current price is: $2.50.

Editor IJSMI
Product Specs:
- File Type: PDF
- File Size: 748.3 KB
- Book Language: English
- Total Page Count: 47
- Instant Download
R Programming, From Fundamentals to Applied Analysis 💻
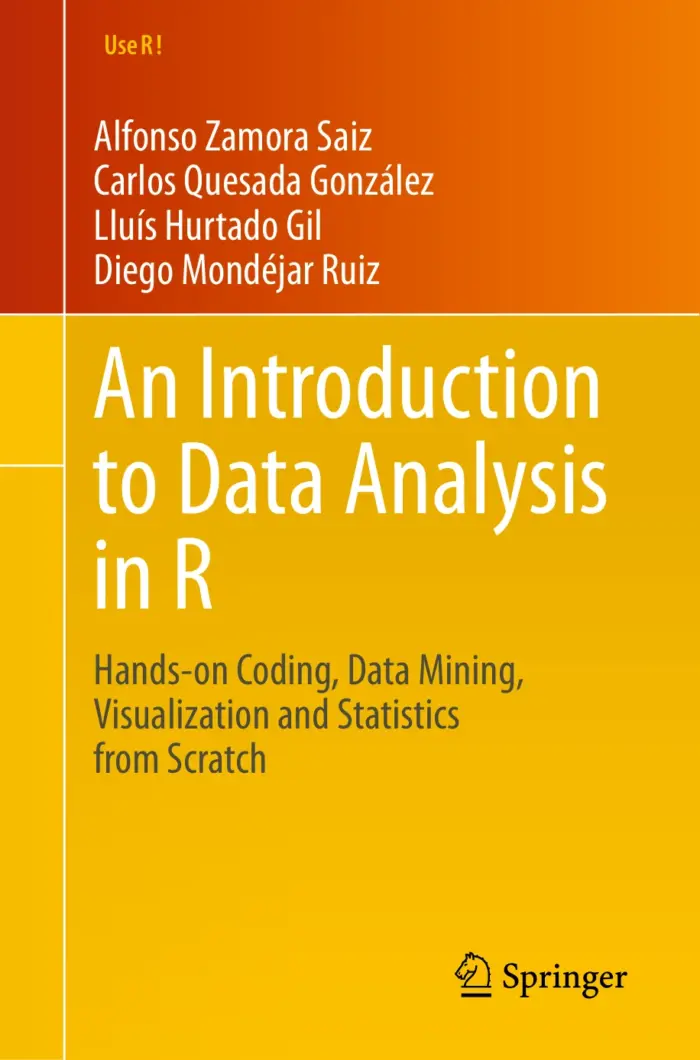
R has become a standard tool for data analysis, statistical modelling, and reproducible research. This guide takes readers through the language from its building blocks to practical applications, with an emphasis on the objects, functions, and workflows that make R useful for real datasets.
Written for the first edition in 2020, the material reflects R 4.0.0 and the broader open-source ecosystem built around CRAN, RStudio, and packages contributed by the R community.
What the Guide Covers
The book is organised into ten chapters that move from core language concepts to specialised analytical tasks. Early chapters establish the grammar of R: vectors, factors, lists, matrices, data frames, and the apply family of functions. From there, readers encounter conditions, loops, functions, and the practical business of reading data from text, CSV, XLSX, SPSS, RData, and RDS sources.
- Data structures and manipulation: vectors, factors, lists, matrices, data frames, sorting, merging, missing values, and the apply family.
- Control flow and functions: if/else logic, loops, user-defined functions, and code organisation.
- Data input and output: importing from common formats, writing results, and saving sessions.
- Database connections: working with databases from within R.
- Visualization: scatter plots, line graphs, bar charts, histograms, box plots, pie charts, stem-and-leaf diagrams, and ggplot2 examples.
Statistics and Machine Learning in the Same Workflow 📊
Later chapters connect R to statistical reasoning. Descriptive statistics, probability distributions, correlation, regression—including simple, multiple, logistic, and quantile regression—and hypothesis testing are presented as part of a coherent analytical process. The book also introduces supervised and unsupervised machine learning: k-nearest neighbours, neural networks, decision trees, random forests, support vector machines, naïve Bayes, hierarchical clustering, and partitioning clustering.
For readers who want to move from summary statistics to predictive modelling, this section provides a broad map of the methods and the R tools used to implement them.
Interactive Web Applications and Reporting
A final chapter looks at R Shiny for building interactive web pages. This extends R beyond the console and script, showing how analyses can become accessible interfaces for others. Combined with the visualization and reporting material earlier in the guide, it points toward complete data products rather than isolated calculations.
Who This Digital Guide Is For 🧠
The book is suited to students, analysts, researchers, and programmers who are learning R or who want a structured reference across statistics and machine learning. Beginners will find the early chapters build a foundation from the ground up. More experienced readers may use the later chapters to review methods, explore ggplot2, or connect R to databases and Shiny applications.
Why It Works as a Practical Reference
Rather than treating each topic in isolation, the guide links language syntax, data handling, statistical techniques, and machine learning models. That structure helps readers understand how a dataset moves from import to cleaning, exploration, modelling, and presentation. The included examples and chapter organisation make it useful both for sequential study and for targeted lookup.
Start Working with R
If you are ready to build confidence with R and its analytical ecosystem, this guide offers a clear path from the first vector to interactive results. It is a focused resource for anyone who wants to use R for data analysis, statistics, and machine learning.
User Reviews
Be the first to review “R Programming – a Comprehensive Guide: Software”
You must be logged in to post a review.
Original price was: $5.00.$2.50Current price is: $2.50.
There are no reviews yet.