

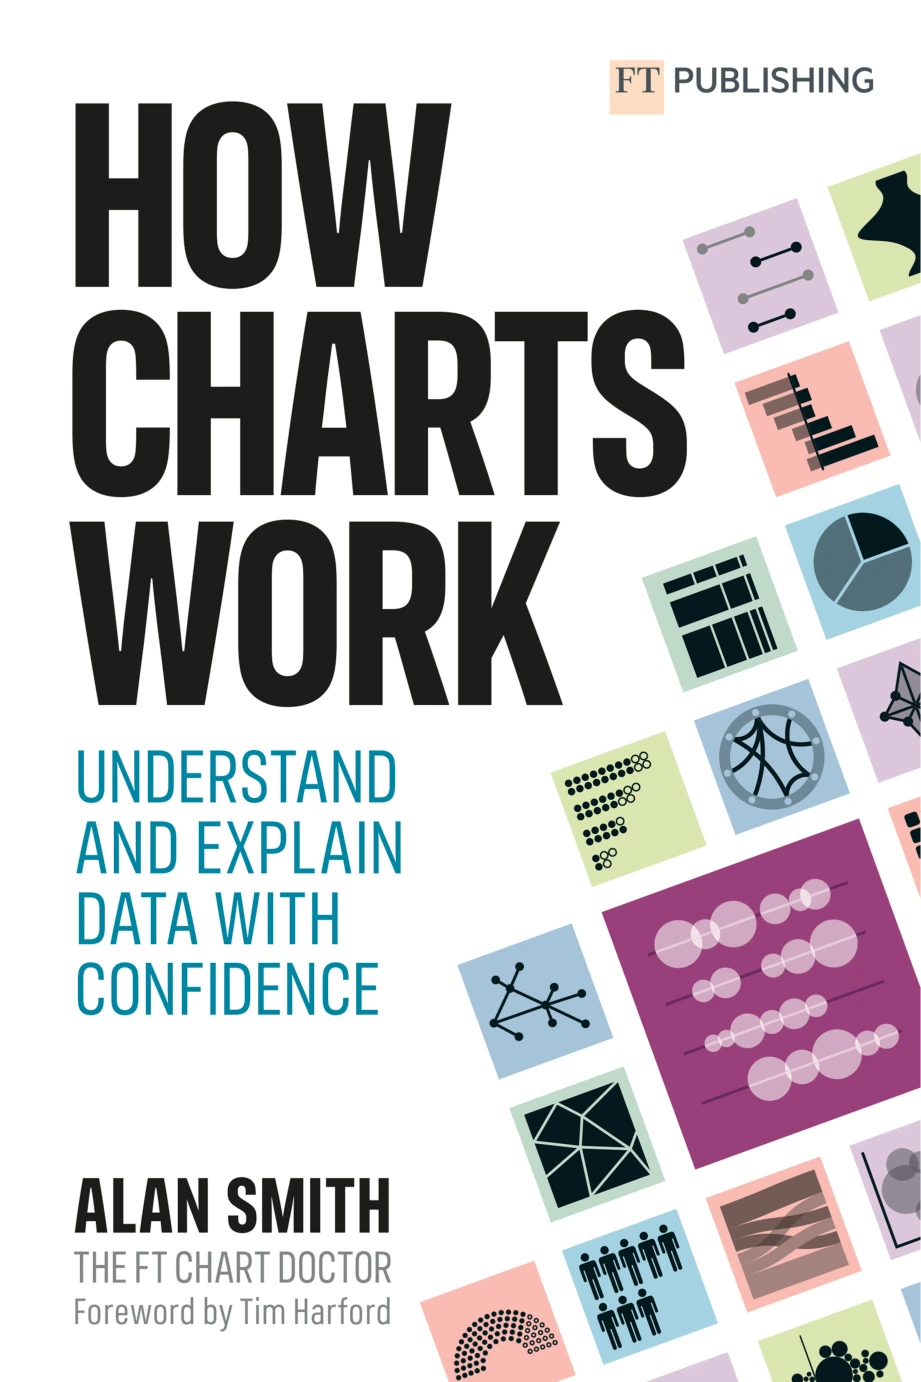
How Charts Work: Understand and Explain Data with Confidence
Original price was: $17.37.$8.69Current price is: $8.69.

Alan Smith
Product Specs:
- File Type: PDF
- File Size: 84.0 MB
- Book Language: English
- Total Page Count: 335
- Instant Download
A chart can make a complex subject easier to see—or make the wrong story look convincing. In How Charts Work, Alan Smith examines how to read, choose and design charts so that data is communicated clearly and thoughtfully. The book moves beyond recognising chart types to ask the more useful questions: what does this visual actually show, and is it the right way to show it?
Get to know the chart choices
The first part introduces the Financial Times visual vocabulary and surveys charts used to show magnitude, change over time, correlation, distribution, flow, ranking, deviation and part-to-whole relationships. A chapter on spatial information extends the discussion to maps. This broad tour gives readers a framework for recognising what different visual forms are designed to communicate.
Look beyond the shape of the graph
Choosing a chart is only part of the work. Smith also considers the science behind effective visuals, the consequences of scales and axes, the role of writing and the decisions involved in chart design. These topics encourage a more critical approach: a graph’s labels, framing and presentation affect how its data is understood.
Make room for uncertainty
A case study on visualising uncertainty brings attention to information that charts can obscure when they appear more definite than the evidence allows. The book also considers how an organisation might use the FT Visual Vocabulary, connecting the discussion of individual charts with practical questions about visual communication.
For readers who work with data—or read it every day
With its mix of chart types, design principles and interpretation, this book is suited to people who create or explain data visuals, as well as readers who want to assess charts more carefully. Its subject spans data journalism, business communication and everyday encounters with graphs and statistics.
Clearer charts begin with better questions. Alan Smith’s guide offers a grounded way to consider what a visual says, how it says it and whether it serves the data.
User Reviews
Be the first to review “How Charts Work: Understand and Explain Data with Confidence”
You must be logged in to post a review.

Cómo restaurar y reparar muebles
Sold by Alan Smith Original price was: $17.37.$8.69Current price is: $8.69.





There are no reviews yet.