

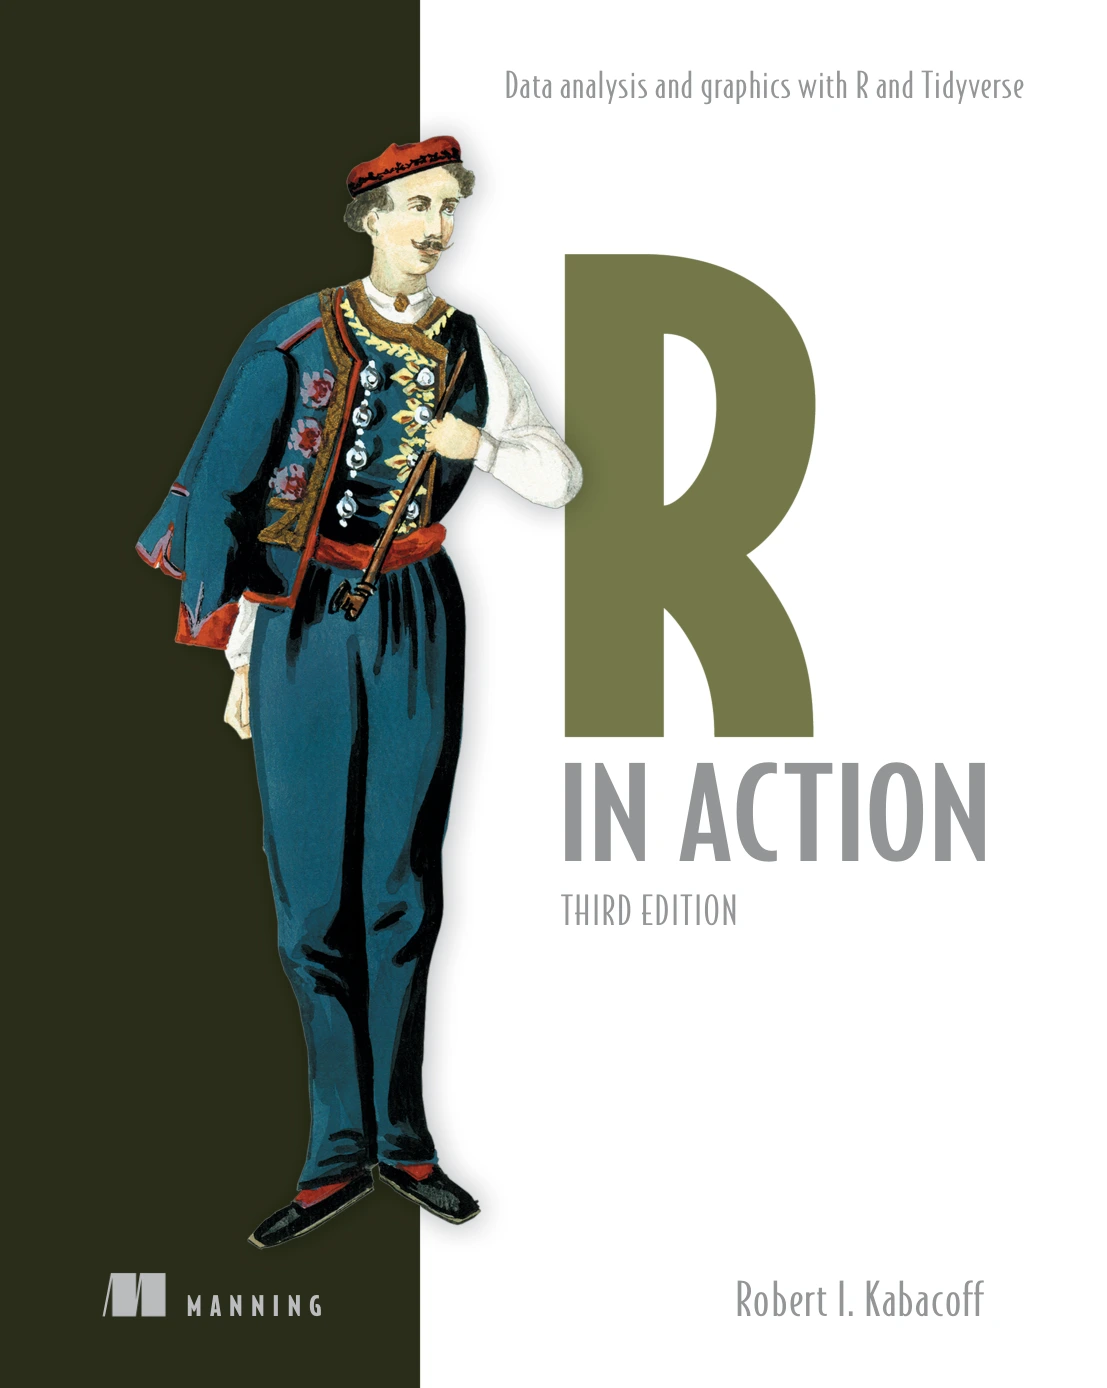
R in Action, Third Edition: Data Analysis and Graphics with R and Tidyverse
Original price was: $5.00.$2.50Current price is: $2.50.

Robert I. Kabacoff
Product Specs:
- File Type: PDF
- File Size: 19.9 MB
- Book Language: English
- Total Page Count: 656
- Instant Download
Data Analysis and Graphics, Taught Through R
R is one of the most widely used languages for statistics and data analysis, but learning it well means more than memorizing syntax. R in Action, Third Edition builds a working understanding of R through data management, visualization, statistical modeling, and reporting. Robert I. Kabacoff pairs concise explanations with realistic examples, so the material stays connected to the kinds of tasks analysts actually face.
What the Third Edition Brings to the Table
This edition adds the Tidyverse to the book’s established approach. That matters because modern R work increasingly relies on tidy data principles and packages such as dplyr, ggplot2, and tidyr. The result is a guide that respects R’s traditions while preparing readers for current data-science workflows.
From Basic Graphs to Advanced Models 📊
The book moves in five broad parts:
- Getting started: installing R, working in RStudio, managing datasets, and handling basic data tasks.
- Basic methods: core graphs and foundational statistics.
- Intermediate methods: regression, analysis of variance, power analysis, resampling, and bootstrapping.
- Advanced methods: generalized linear models, principal components and factor analysis, time series, cluster analysis, classification, and missing-data techniques.
- Expanding your skills: advanced graphics, programming, dynamic reports, and building an R package.
Graphics That Explain the Data 📈
Visualization is not treated as decoration. The book shows how graphs can reveal structure, check assumptions, and communicate results. Readers move from basic plots toward advanced graphics, learning how R turns raw numbers into something others can interpret and act on.
Building a Workflow, Not Just a Set of Commands
Each technique is placed in a practical context. Data cleaning, statistical modeling, and reporting are presented as connected stages rather than isolated tricks. That makes the book useful for readers who want to complete an analysis from start to finish and understand why each step matters.
Who Will Get the Most From It 🧠
The material suits data analysts, researchers, students, and professionals who already have a basic grounding in statistics and want to apply R more effectively. Beginners can grow with it, while experienced users can turn to specific chapters for regression, clustering, time series, or missing-data methods.
Read It as a Course or a Reference
Work through the chapters in order to build a broad foundation, or jump to the methods you need for a current project. Either way, R in Action, Third Edition offers a clear, example-driven path into R’s analytical and graphical capabilities.
User Reviews
Be the first to review “R in Action, Third Edition: Data Analysis and Graphics with R and Tidyverse”
You must be logged in to post a review.
Original price was: $5.00.$2.50Current price is: $2.50.





There are no reviews yet.