

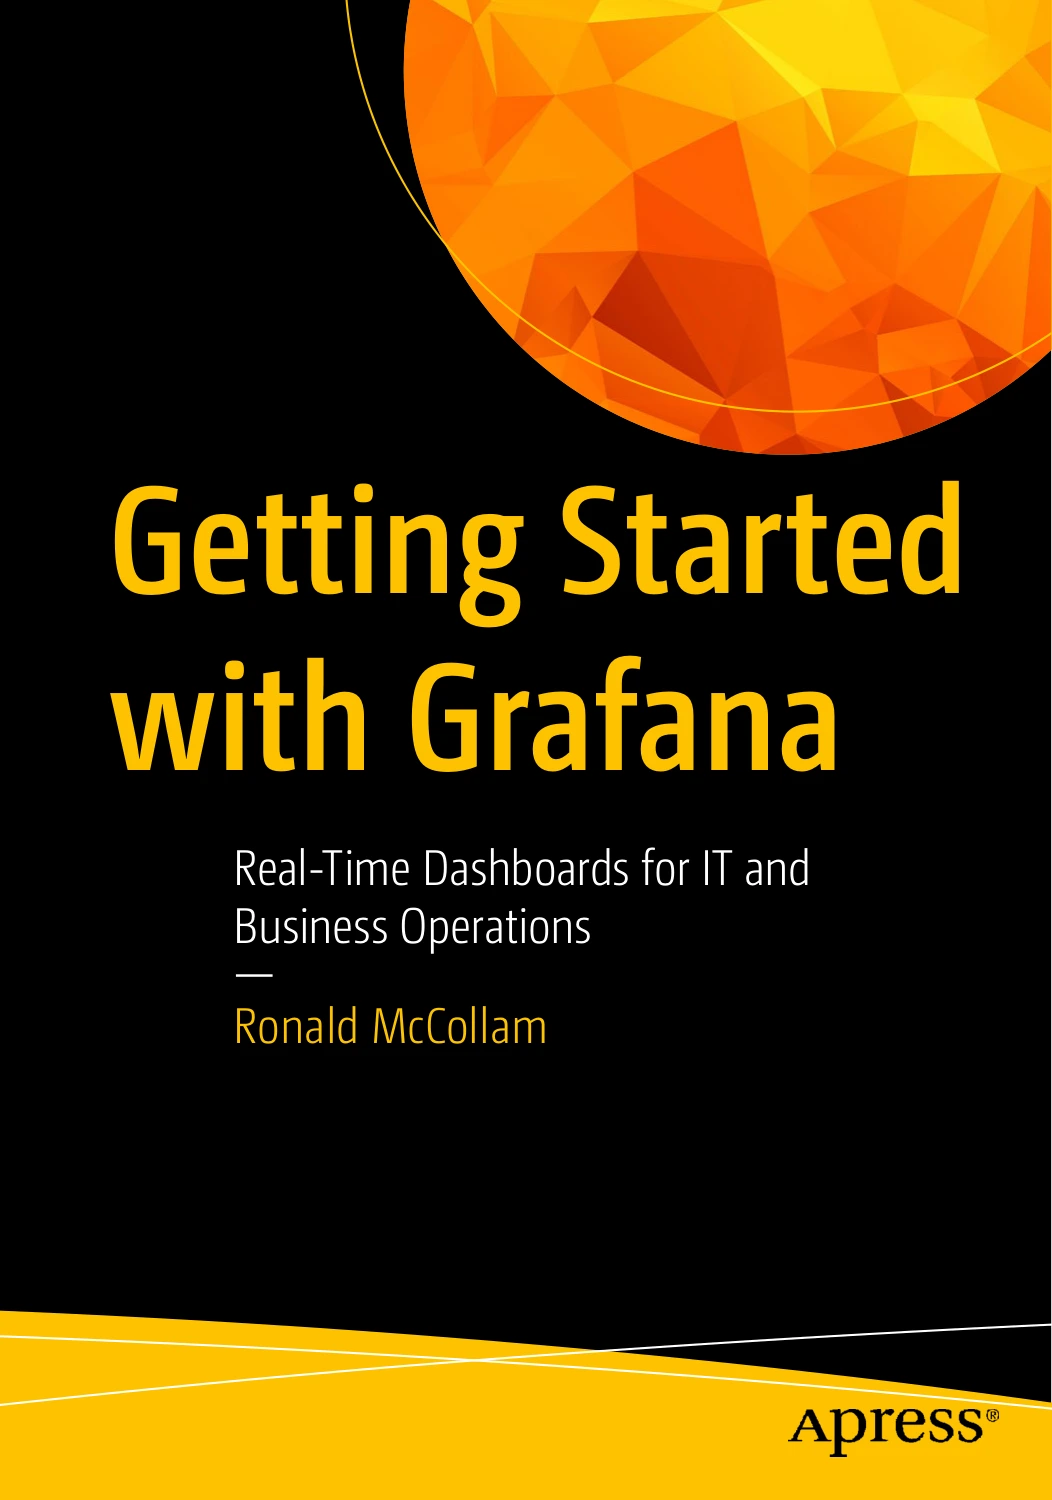
Getting Started with Grafana: Real-Time Dashboards for IT and Business Operations
Original price was: $59.99.$30.00Current price is: $30.00.

Ronald McCollam
Product Specs:
- File Type: PDF
- File Size: 21.9 MB
- Book Language: English
- Total Page Count: 367
- Instant Download
Grafana dashboards are most useful when they turn data from scattered systems into a view people can act on. Ronald McCollam’s Getting Started with Grafana takes a hands-on route to that work, moving from first steps in the platform to dashboard design, alerts, and more advanced ways to deploy and manage Grafana.
Start with panels, then build the bigger picture
The book begins with Grafana Cloud, the interface, and the basic building blocks of visualizations. From there, readers work toward dashboards that surface important information clearly, organize panels into useful workflows, and present real-time status in a way that supports monitoring and operational decisions.
Bring data sources together
Grafana’s value depends on reaching data where it lives. McCollam covers connecting data sources and working with multiple sources in a dashboard, including ways to keep views consistent and combine or transform information. The result is a practical look at how visualization can help make a fragmented data landscape easier to explore.
Make dashboards more useful and responsive
Dedicated chapters explore advanced panels, transformations, dashboard variables, and alerting. These capabilities let readers move beyond a static collection of charts toward dashboards that can adapt to different contexts and help draw attention to changing conditions.
From local setup to advanced administration
Alongside dashboard building, the book addresses local deployment, user administration, enterprise integrations, and advanced deployment and management. Its later material includes programmatic Grafana and Grafana Enterprise, extending the discussion from using the interface to managing and automating the platform.
Learn by doing
This is a practical Grafana guide for readers who want to build familiarity through examples. It is especially relevant to IT professionals working with data across systems, as well as readers who want to visualize operational or business information and communicate what it shows.
For a clearer view of the systems you monitor, start with the panels, follow the data, and build dashboards that make the important signals easier to see. 📊
User Reviews
Be the first to review “Getting Started with Grafana: Real-Time Dashboards for IT and Business Operations”
You must be logged in to post a review.
Original price was: $59.99.$30.00Current price is: $30.00.




There are no reviews yet.