

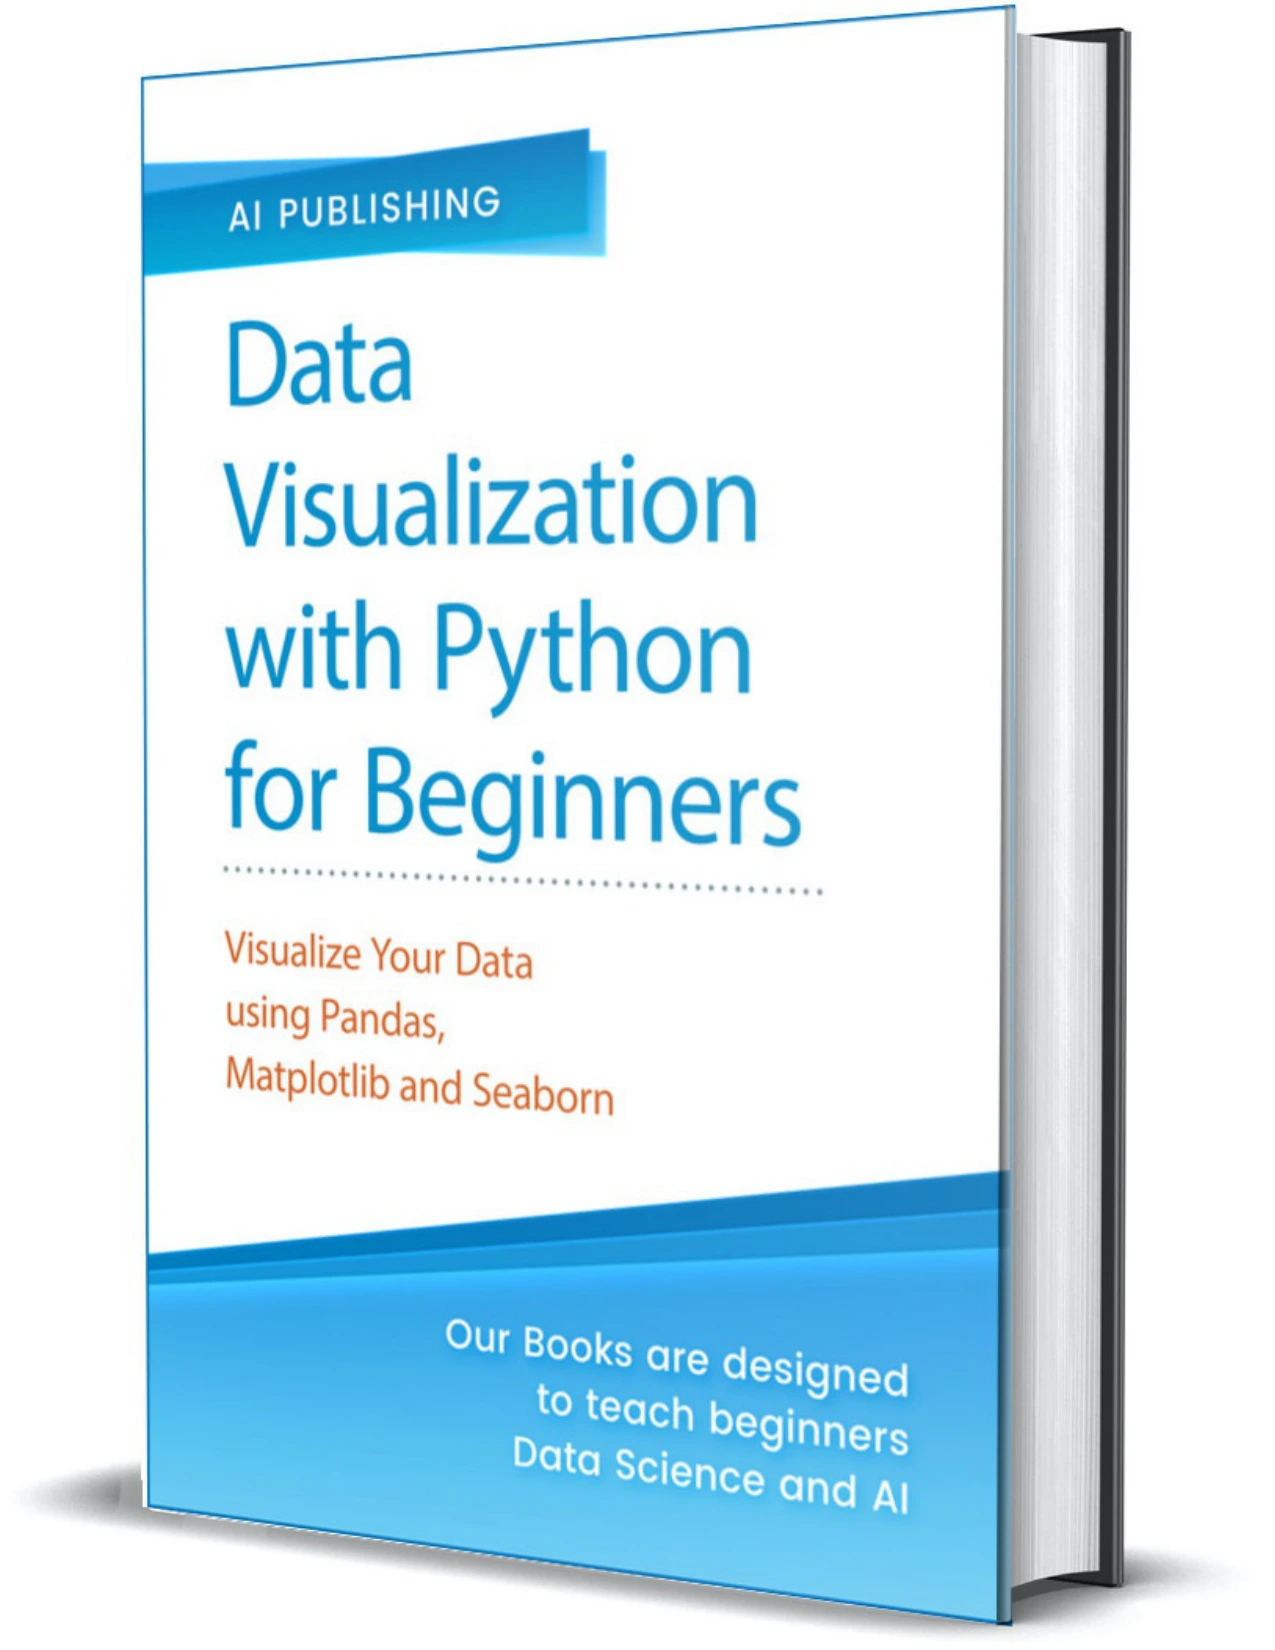
Data Visualization with Python for Beginners: Visualize Your Data Using Pandas, Matplotlib and Seaborn
Original price was: $29.99.$14.99Current price is: $14.99.

AI Publishing
Product Specs:
- File Type: PDF
- File Size: 9.1 MB
- Book Language: English
- Total Page Count: 300
- Instant Download
Good data visualization begins with more than choosing a chart: it means learning how to shape, compare and present information clearly. This practical introduction takes new learners through Python’s plotting toolkit, from basic Matplotlib charts to Seaborn visualizations and the Pandas operations that help prepare data for analysis.
The progression is deliberately hands-on. Readers start with Python fundamentals and setup, then build familiarity with chart types and the data structures behind them, with exercises included along the way.
Start with the essentials, then build your plotting skills 💻
The opening chapters introduce data visualization, a Python crash course and the relevant libraries before moving into Matplotlib. Topics include line, scatter and bar plots, histograms, pie charts and stacked plots, along with titles, labels, legends and plotting from CSV or TSV data. Later Matplotlib material explores multiple plots, object-oriented plotting, subplots and saving figures.
Explore patterns with Seaborn
Seaborn expands the toolkit with distribution, joint and pair plots, plus bar, count, box, violin, strip and swarm plots. Further topics include styling, heat maps, cluster maps, pair grids, facet grids and regression plots. Seeing these options side by side helps readers consider which visual form suits the question and data at hand.
Bring Pandas into the workflow
The contents also introduce Pandas for data analysis, including reading data into dataframes, filtering rows and columns, concatenating and sorting data, applying functions, pivot tables and crosstabs, and arithmetic operations with where. These data-handling skills connect chart creation with the preparation that often comes before it.
Learn by trying the examples
Exercises are listed across the chapters, and the publisher’s ebook description also identifies hands-on projects using datasets. The book is suited to beginners in Python and data visualization who want a guided first pass through Matplotlib, Seaborn and Pandas, with room to practice as they go.
For readers ready to make their first charts—or to understand the plotting choices available in Python—this guide offers a structured place to begin. 📊
User Reviews
Be the first to review “Data Visualization with Python for Beginners: Visualize Your Data Using Pandas, Matplotlib and Seaborn”
You must be logged in to post a review.
Python Crash Course for Data Analysis: A Complete Beginner Guide for Python Coding, NumPy, Pandas and Data Visualization
Sold by AI Publishing
Python Machine Learning for Beginners: Learning from Scratch Numpy, Pandas, Matplotlib, Seaborn, SKlearn and TensorFlow 2.0 for Machine Learning & Deep Learning – With Exercises and Hands-on Projects
Sold by AI Publishing Original price was: $29.99.$14.99Current price is: $14.99.




There are no reviews yet.