How to Start Data Analysis with Python
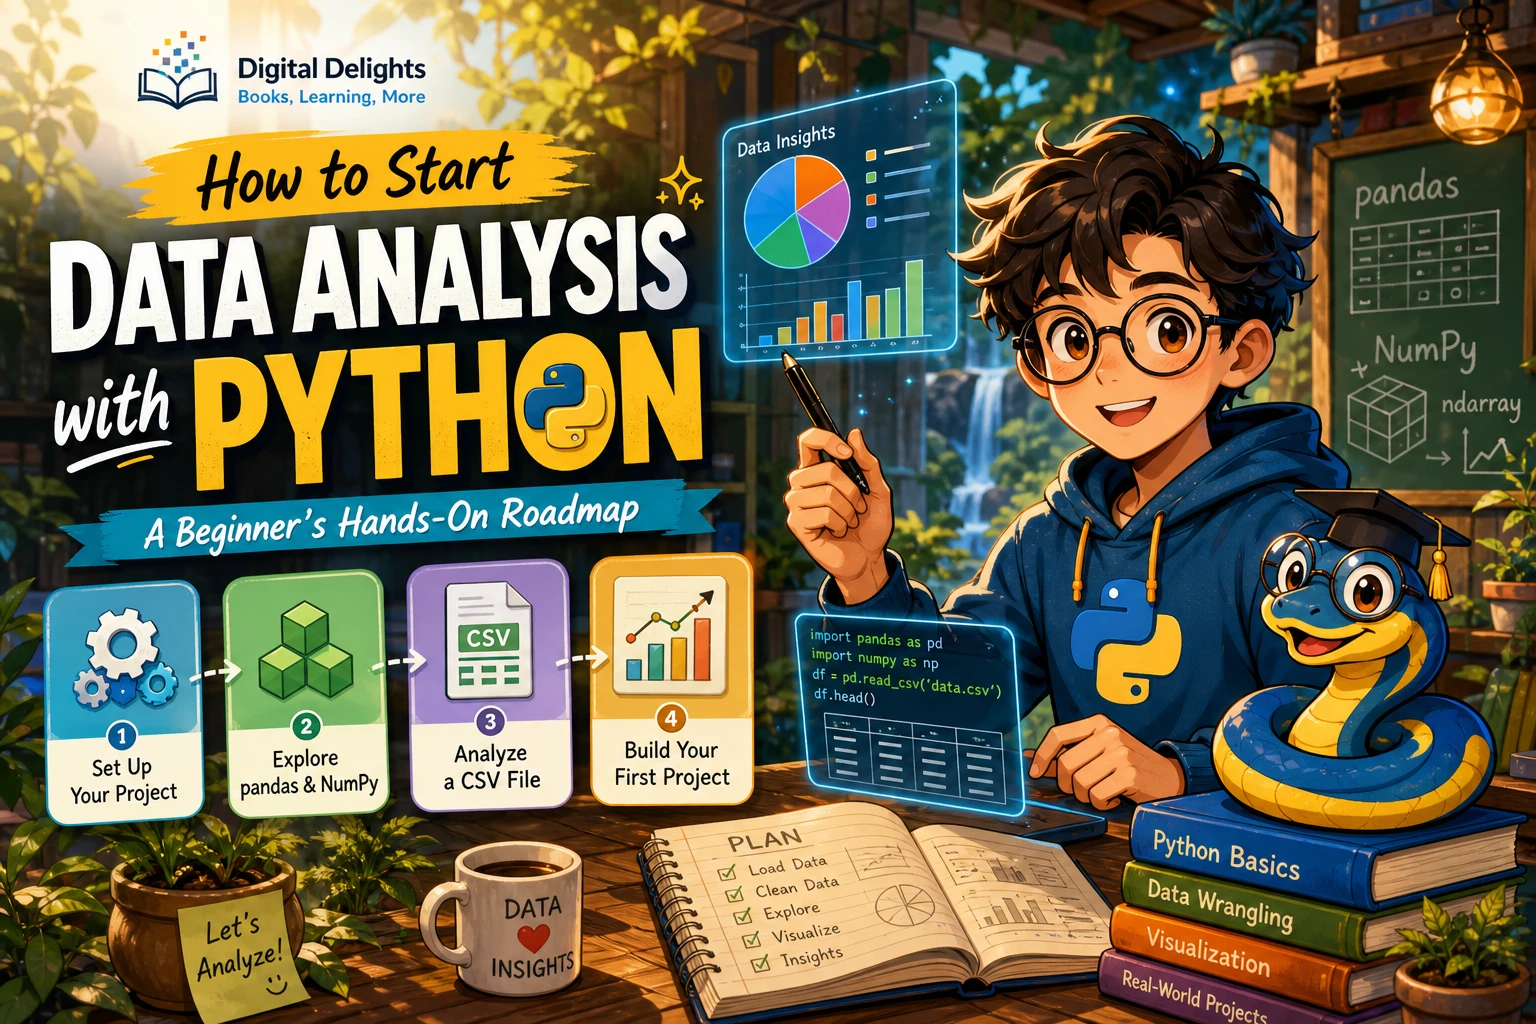
You can begin analyzing data with Python without becoming a machine-learning specialist or mastering advanced mathematics first. Start with a small dataset, learn enough Python to work with its values and files, and practice a simple cycle: inspect, clean, summarize, visualize, and explain what you found.
This guide lays out that beginner path, explains the main tools, and walks through a first analysis workflow. You will also find a practice-project idea and guidance on what to learn next, depending on your goals.
What you need to know before you start
It helps to be familiar with a few Python basics: variables, lists and dictionaries, conditions, loops, functions, and reading files. You do not need to know every feature of the language before opening a dataset. If these concepts are new, work through them gradually; the official Python tutorial’s introduction provides a starting point.
There is no single mathematics threshold that every beginner must meet. For descriptive analysis, begin with averages, counts, percentages, and the ability to read a chart. More formal statistics will be useful as your questions require them. You can add those ideas alongside practical work instead of treating advanced mathematics as a gate you must pass first.
Set up a project you can return to
Install a current Python version using an official distribution source, then keep each project’s dependencies separate. A virtual environment isolates project packages, which helps avoid conflicts between projects. Python’s documentation describes creating one with python -m venv .venv and explains how to activate it on different operating systems: Virtual Environments and Packages.
Choose either a notebook or a Python script to begin. A notebook is convenient when you want to run analysis a step at a time and see tables or charts alongside your notes. A script is useful when you want to run a sequence of saved instructions from start to finish. Neither is the universal best choice: use whichever makes it easier to understand and repeat your work.
Package support changes over time, so check the current compatibility information for Python and the libraries you plan to use before installing them. Avoid copying an old installation recipe without checking whether its versions still fit your environment.
Learn the core Python data analysis tools
- NumPy provides tools for working with arrays and numerical operations.
- pandas helps you work with tabular data, such as rows and columns loaded from a CSV file.
- Jupyter provides an interactive notebook environment for running code and recording observations.
- Matplotlib can turn data into plots that help you explore patterns and communicate results.
You do not need to learn every library feature at once. A practical first milestone is loading a table with pandas, checking its contents, calculating a few summaries, and making one clear plot. O’Reilly’s Python for Data Analysis, 3rd Edition describes coverage that includes tools such as NumPy, pandas, Jupyter/IPython, and Matplotlib. Its edition information is a reminder to check whether any version-specific guidance in a learning resource matches your current setup.
Follow a first analysis workflow
Choose a CSV file with clear column names and a manageable number of rows. The example below assumes you have pandas and Matplotlib available in your environment and a file called sales.csv with columns named date, region, and revenue. Change those names to match your own file.
1. Load the file and inspect its shape
import pandas as pd

df = pd.read_csv("sales.csv")
print(df.head())
print(df.shape)
print(df.dtypes)
Looking at the first rows, dimensions, and data types gives you an initial sense of what was loaded. Check that headers look as expected and that numbers and dates were not read as the wrong kind of value.
2. Check for missing or unexpected values
print(df.isna().sum())
print(df["region"].value_counts(dropna=False))
print(df["revenue"].describe())
Missing values are not automatically errors: they may have a meaningful reason. Before changing or removing them, work out what they represent and whether they affect the question you want to answer. Also look for unexpected categories, inconsistent labels, or values that seem implausible.
3. Clean or transform only what the question requires
For example, if dates were imported as text, convert them before grouping records by month. If region names contain accidental spaces, standardize them. Keep the original data unchanged where possible, and make each transformation explicit so you can explain how the analysis was prepared.
df["date"] = pd.to_datetime(df["date"], errors="coerce")
df["region"] = df["region"].str.strip()
With errors="coerce", values that cannot be parsed as dates become missing. Check how many values were affected before proceeding; do not silently treat the conversion as successful.
4. Calculate a summary that answers a question
Suppose you want to compare total revenue by region. Grouping makes the question explicit:
revenue_by_region = (
    df.groupby("region")["revenue"]
      .sum()
      .sort_values(ascending=False)
)
print(revenue_by_region)
Consider whether a total, average, count, or another measure actually fits your question. Averages can hide variation, and totals can be affected by groups having different numbers of records.
5. Plot the result, then interpret it
import matplotlib.pyplot as plt

revenue_by_region.plot(kind="bar")
plt.ylabel("Total revenue")
plt.xlabel("Region")
plt.title("Revenue by region")
plt.tight_layout()
plt.show()
A chart is useful when it makes a comparison easier to see, not just because a plotting library is available. Check the labels, units, scale, and categories. Then write a sentence describing the pattern and any limitation. A chart can show that one region has a larger total in this file; by itself, it does not explain why.
Try a small practice project
Start with a dataset you understand or can describe. A personal expense export, a small work spreadsheet you are allowed to use, or a made-up table of sample transactions can all provide practice. Avoid sharing private or sensitive records. If you create a toy dataset, include columns such as date, category, and amount.
Choose two or three questions before coding, such as:
- Which categories account for the largest total amount?
- How does the amount change over time?
- Are there missing dates, unusual values, or categories that need standardizing?
Save your steps and findings together. A useful project is not just a chart: it records the question, the data checks, the decisions made during cleaning, the result, and what the analysis cannot establish.
Common beginner mistakes to avoid
- Skipping data checks: Inspect the file before drawing conclusions. Incorrect types, missing values, or inconsistent labels can change a result.
- Cleaning without a reason: Do not delete rows or fill gaps automatically. Decide what a value means and document the choice.
- Confusing analysis with machine learning: Many useful questions can be answered with summaries and charts. Machine learning is a possible later tool, not a required first step. Publisher resources also differ in scope: some focus on data manipulation while others include statistical analysis or modeling, so choose a resource that matches what you want to learn.
- Ignoring package compatibility: Check that the Python version and the versions of your libraries work together. A book or tutorial may explain lasting concepts while showing older setup details.
- Reporting a pattern as a cause: A descriptive result can reveal a difference or trend, but it does not automatically explain what produced it.
Choose what to learn next
After completing a small end-to-end analysis, choose a next step based on the kind of work you want to do:
- Want stronger data handling? Practice filtering, grouping, reshaping, and combining tables with pandas.
- Want to explain patterns more carefully? Learn descriptive statistics and then the statistical methods relevant to your questions.
- Want clearer communication? Practice choosing appropriate charts and writing concise findings with limitations.
- Want to work with spreadsheets? Python for Excel Users: Know Excel? You Can Learn Python is aimed at spreadsheet users and its catalog description covers Python fundamentals, automation, and data handling.
- Want a broad introduction to data science? The Crystal Ball Instruction Manual, Volume One: Introduction to Data Science covers Python, Jupyter, exploratory data analysis, and introductory machine-learning topics.
- Need a structured Python foundation first? Introduction to Python Programming covers core programming topics and includes an introduction to NumPy, pandas, exploratory analysis, and visualization.
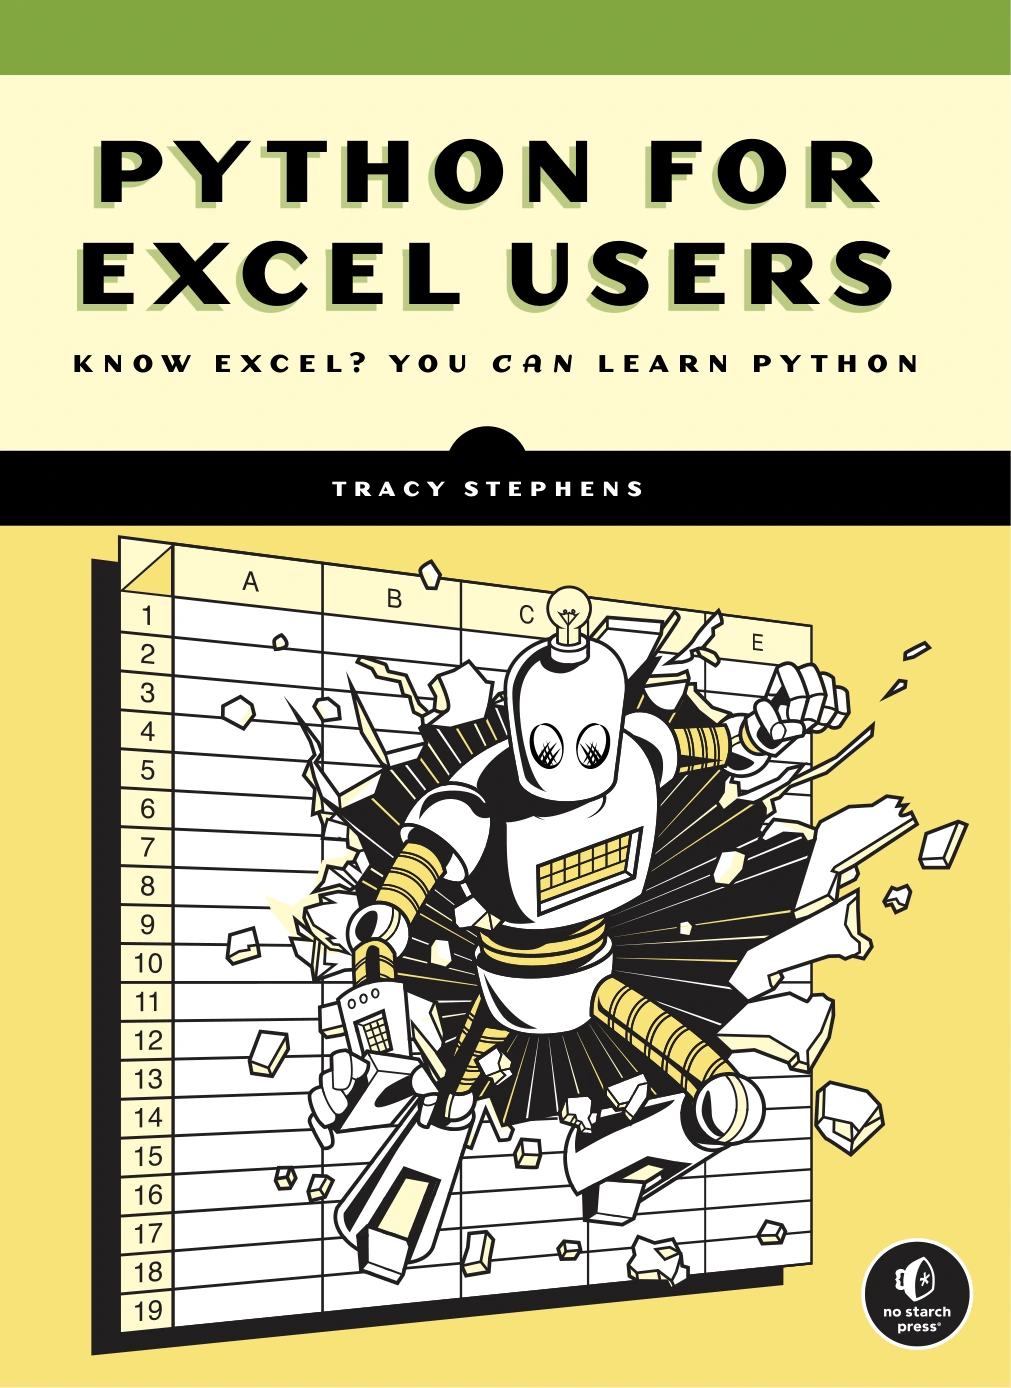
Python for Excel Users: Know Excel? You Can Learn Python
Excel users looking for Python fundamentals, spreadsheet automation, and data-handling guidance.
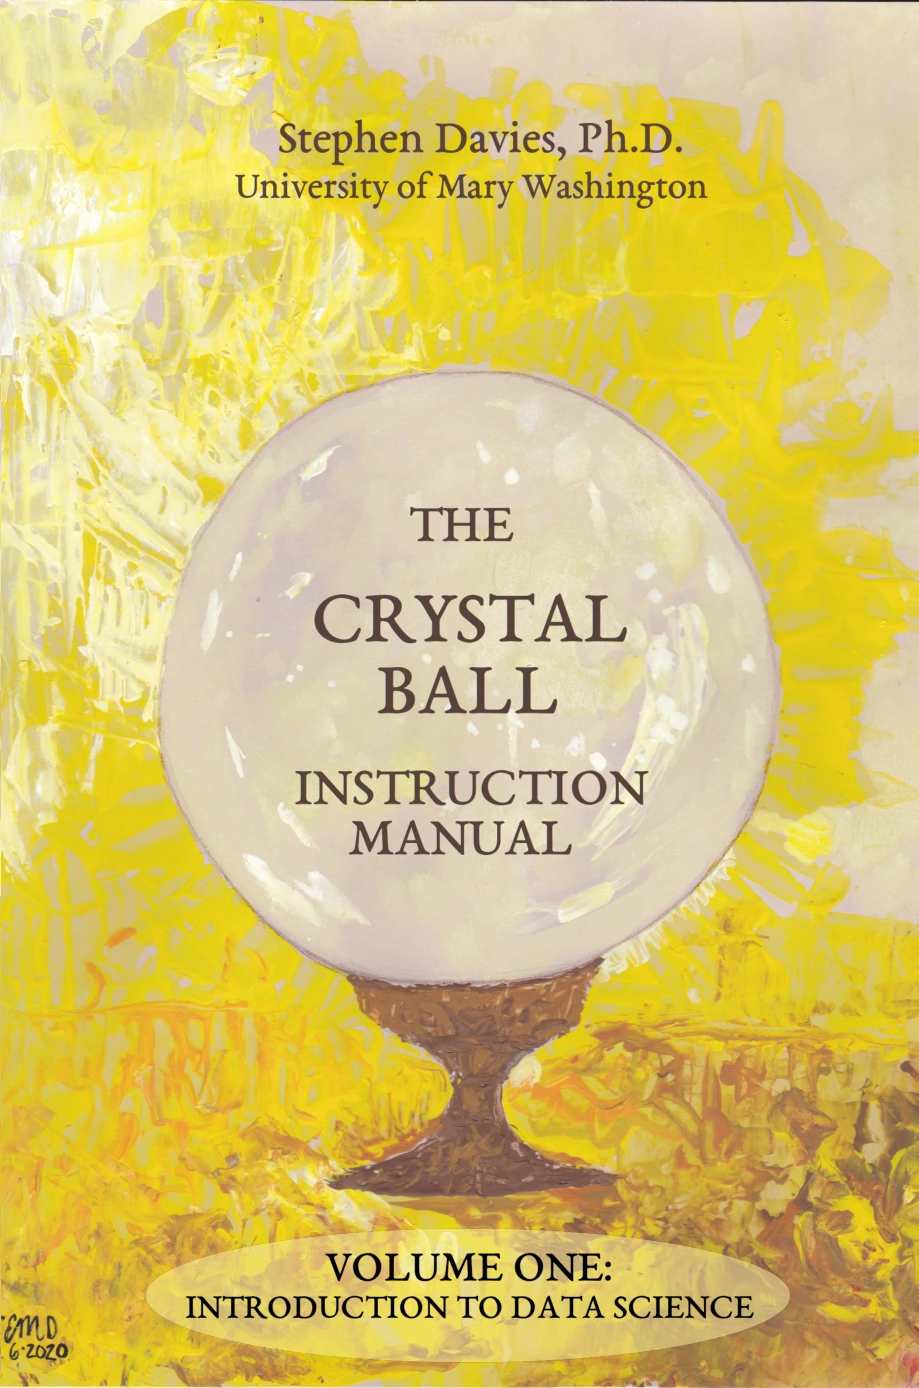
The Crystal Ball Instruction Manual, Volume One: Introduction to Data Science
Learners seeking an introduction that combines Python, Jupyter, exploratory analysis, and data-science topics.
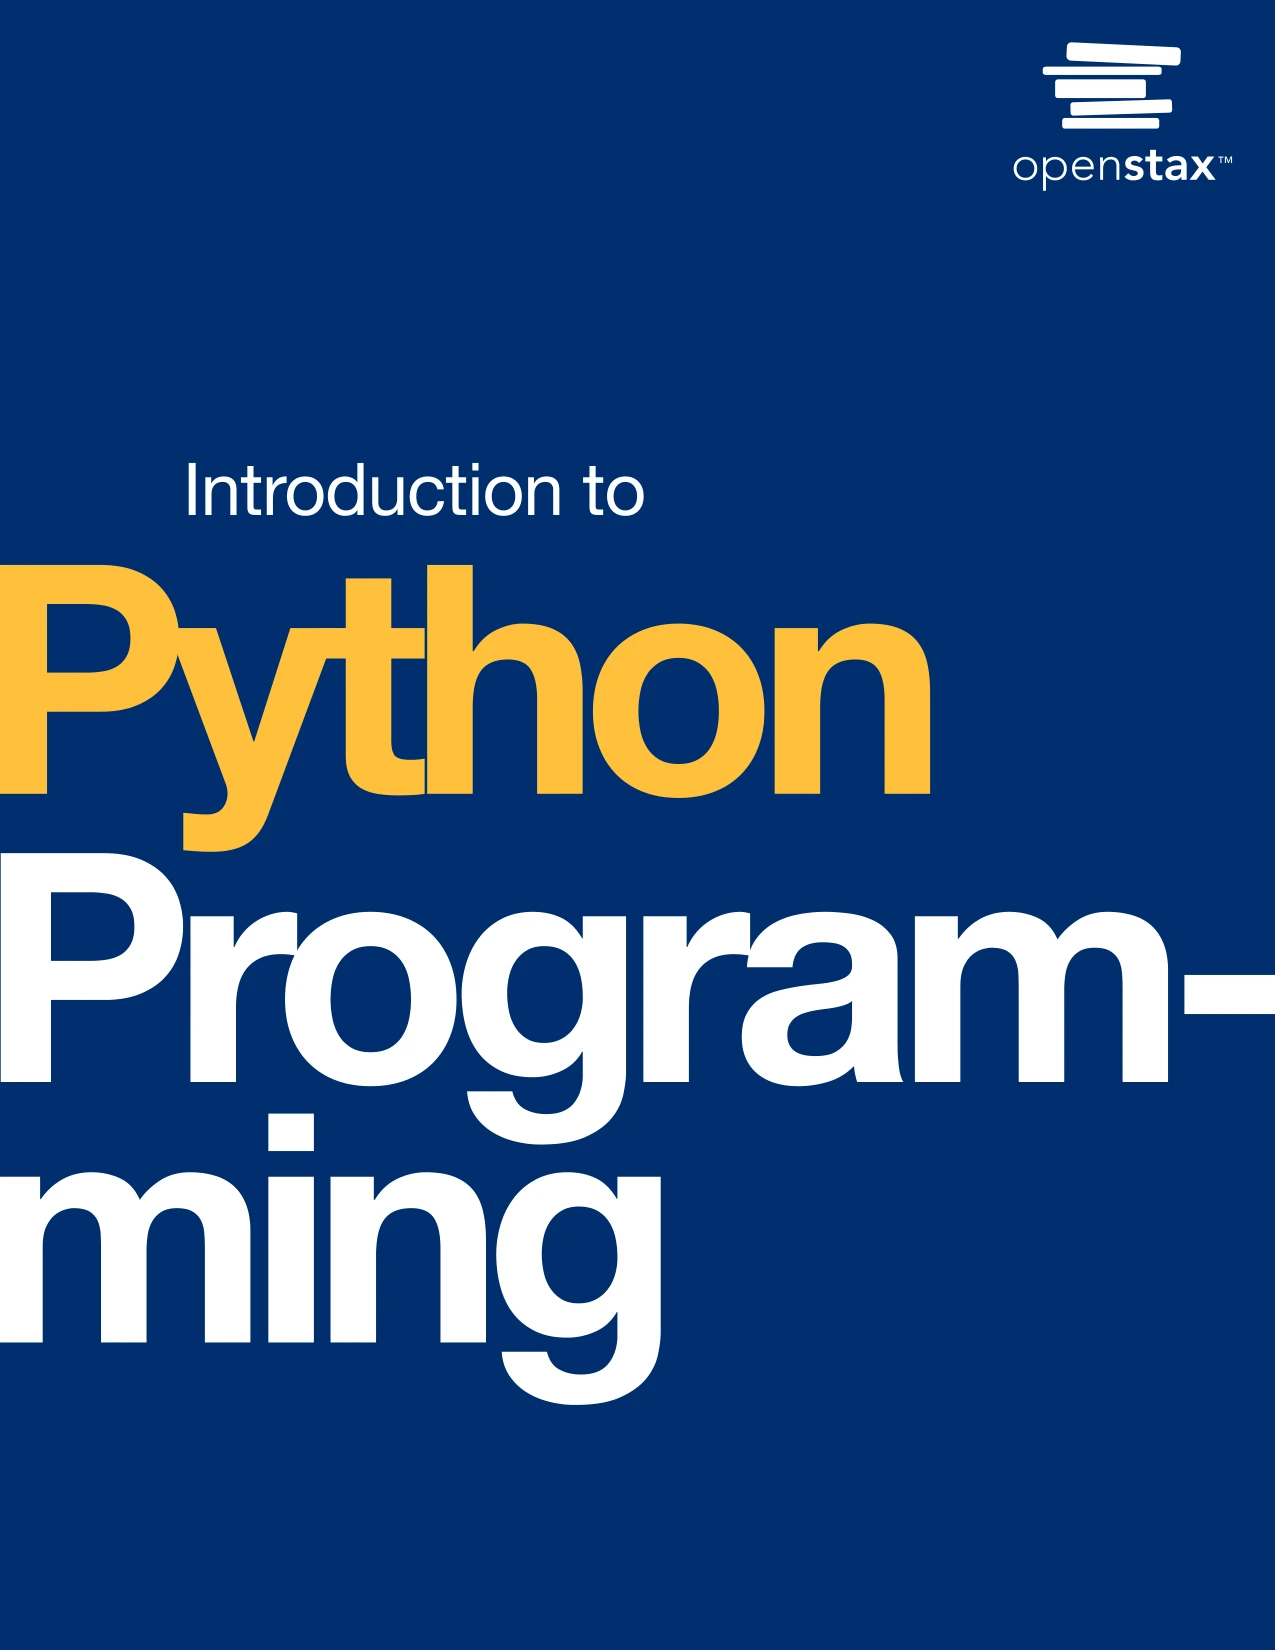
Introduction to Python Programming
By Udayan Das
Beginners wanting core programming concepts along with an introduction to data-science tools.
These resources have different scopes, so compare their descriptions with your current level and goal. You can browse the catalog in short steps rather than trying to study programming, statistics, visualization, and machine learning all at once.
Frequently asked questions
Do I need to know Python before doing data analysis?
Some basics make the first analysis easier, particularly variables, collections, loops, functions, and file handling. You can learn these alongside data work; you do not need to master the whole language before starting.
Do I need advanced mathematics to start data analysis with Python?
No advanced mathematics is needed to begin inspecting data, calculating simple summaries, and making basic plots. Learn more statistics when your questions require it, and be careful not to interpret descriptive results beyond what they show.
Should I use a notebook or a Python script?
Either can work. Notebooks suit step-by-step exploration and inline notes; scripts suit repeatable sequences of instructions. Try both if useful, and choose based on how you prefer to explore and rerun your work.
Do I need machine learning to analyze data?
No. Many analyses involve checking, cleaning, summarizing, and visualizing data without training a predictive model. Start with the question and use the simplest method that can address it responsibly.
Which dataset should I use for practice?
Pick a small, understandable dataset with columns you can explain, such as dates, categories, and amounts. A sample or synthetic dataset is a sensible first choice if you do not have permission to use real records.
Start with one question and one dataset
To start data analysis with Python, learn the essential language basics, set up a separate environment for your project, and practice the full path from loading a file to explaining a result. Keep the first project small. Careful inspection and a clear question will teach you more than adding libraries or machine learning before you need them.