Python for Data Analysis: A Beginner’s Roadmap
Learning Python for data analysis can feel like two challenges at once: understanding a programming language and figuring out what to do with a dataset. The clearest way through is to learn in stages. Start with core Python, add the tools that help you work with arrays and tables, then practise the full process on a small dataset—from asking a question to explaining what you found.
This roadmap is for people who are new to data analysis, new to Python, or both. If you have never programmed before, spend more time on the fundamentals before moving to data libraries. If you already code in another language, you may be able to move through that first stage more quickly. The sequence below is a practical guide, not a claim that every learner needs the same pace or tools.
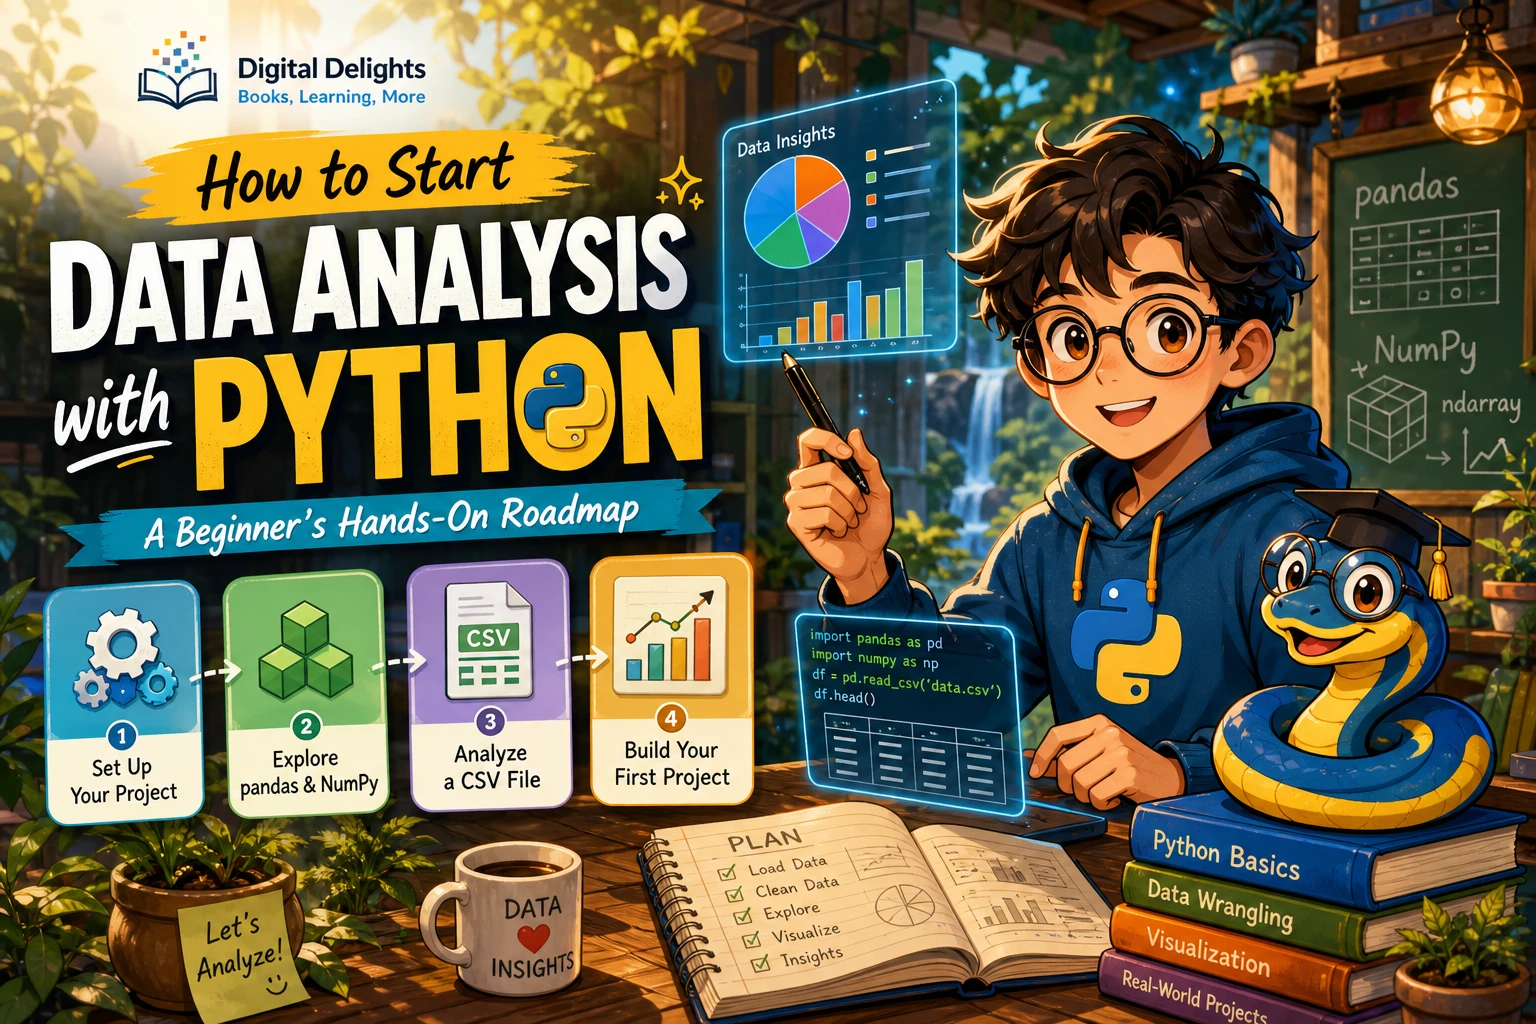
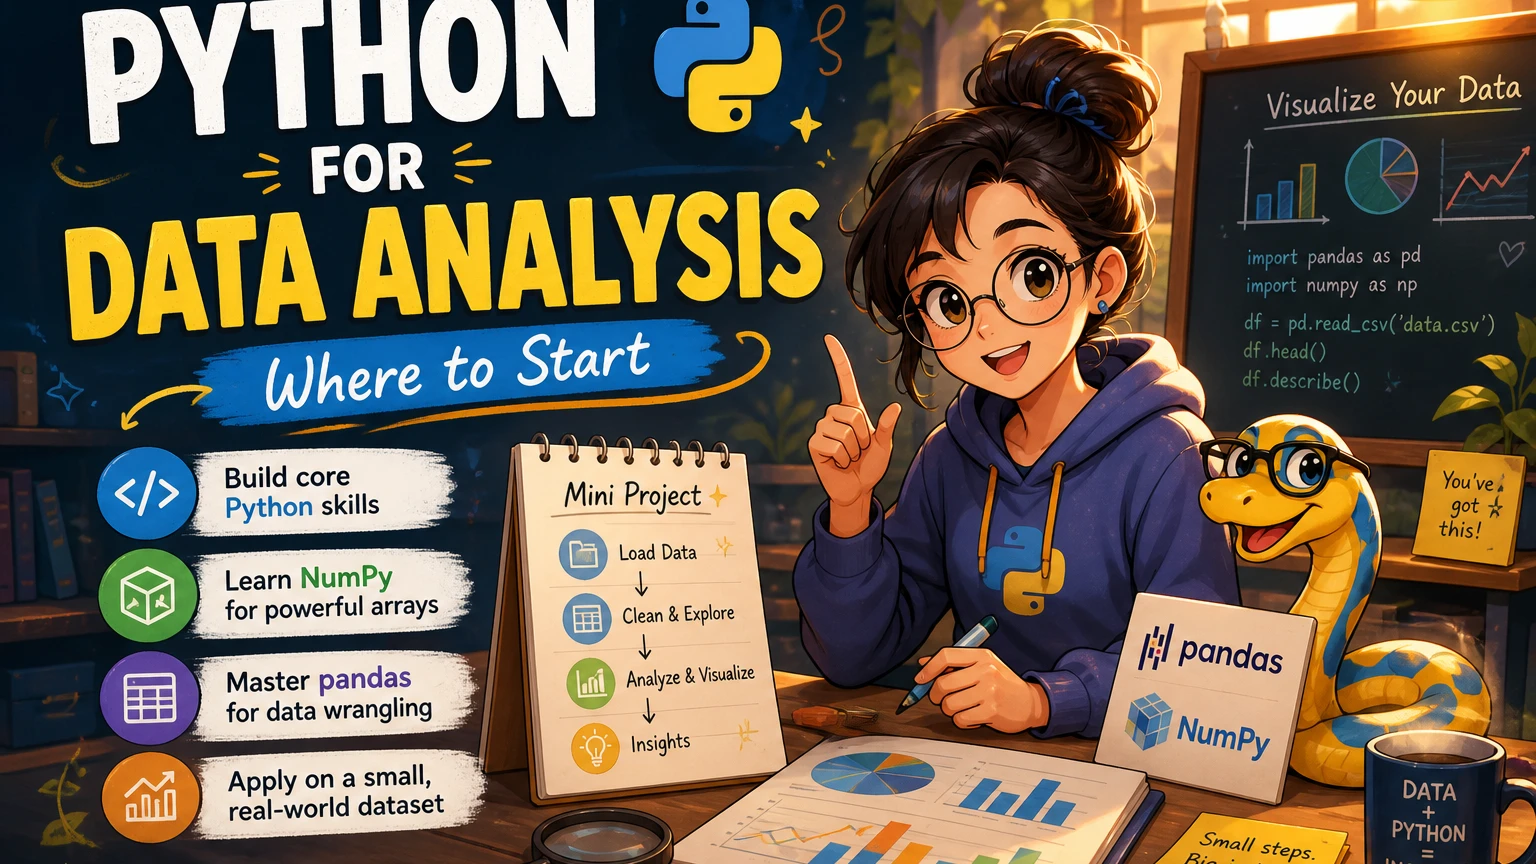
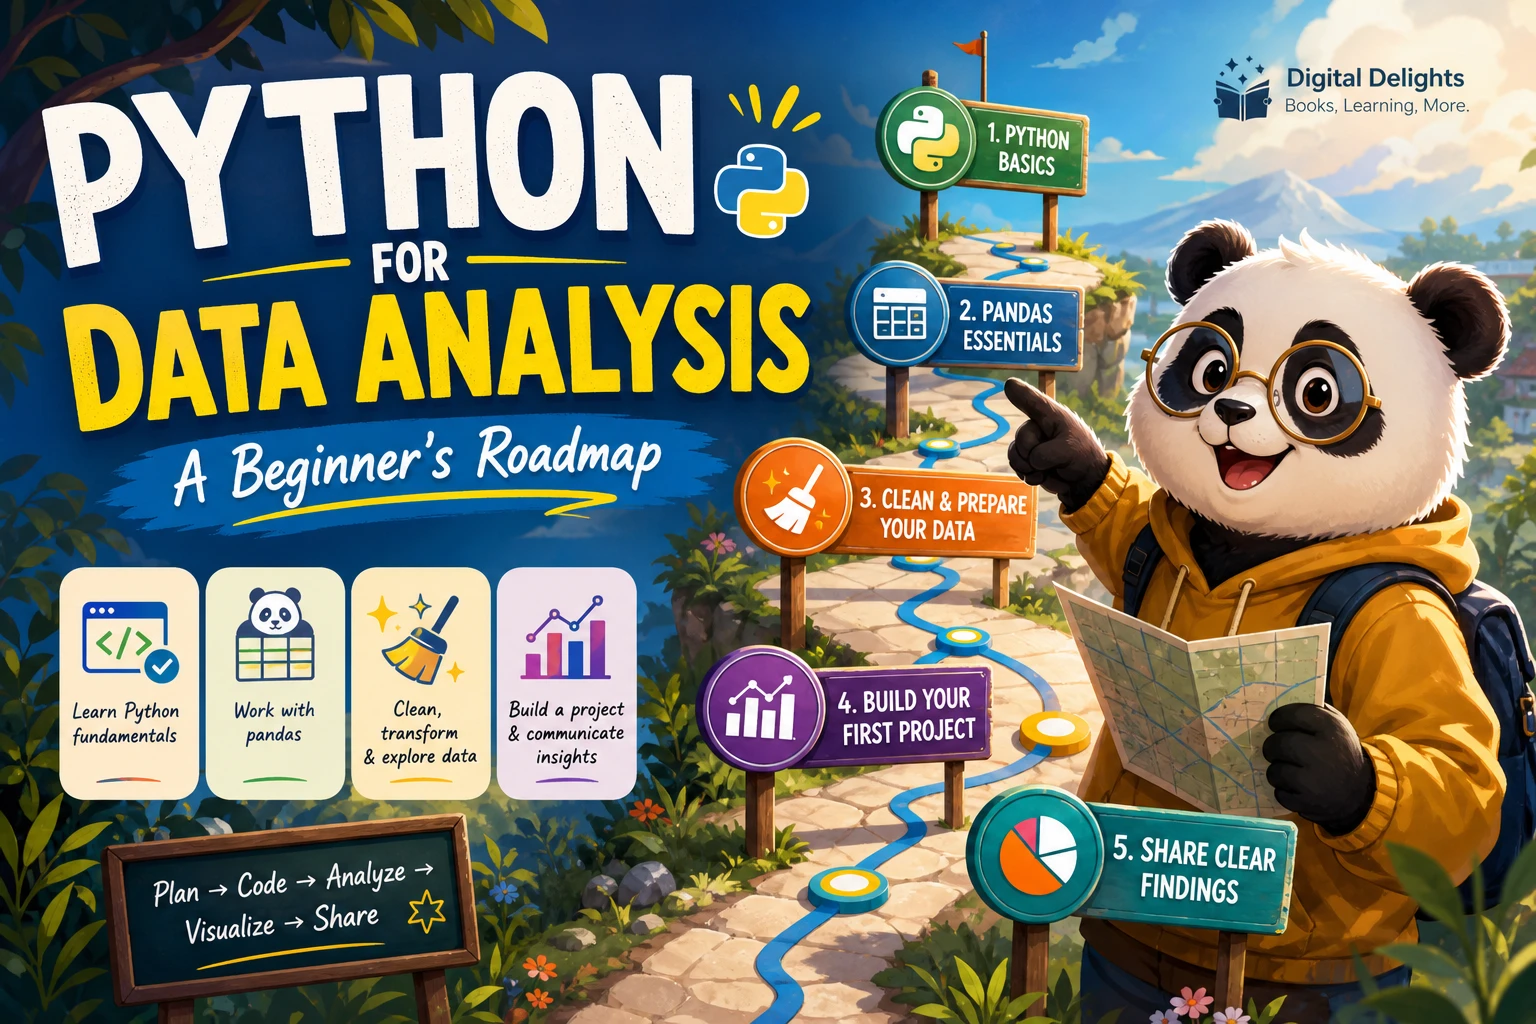
The short version: what to learn, in order
- Set up Python and a project-specific environment.
- Learn variables, collections, conditionals, loops, functions, and basic debugging.
- Use NumPy for numerical arrays and pandas for tabular data.
- Practise loading, inspecting, cleaning, filtering, combining, and summarizing data.
- Make a clear plot and explain what it does—and does not—show.
- Complete a small project and document your question, data source, decisions, and findings.
You do not need to master every Python feature before opening a dataset. You do need enough fluency to understand the steps you are asking your code to perform.
1. Set up a workable Python environment
Begin with a current Python 3 installation and a place to write and run code. That could be a code editor, a notebook environment, or both. Notebooks are useful for trying analysis steps interactively; scripts can make a repeatable sequence of steps easier to run. There is no need to treat one as the only correct starting point.
Keep each learning project organized in its own folder. As you begin installing packages, use a virtual environment for that project rather than relying on one shared package setup for everything. Python’s documentation explains how virtual environments help isolate packages and manage dependencies: Virtual Environments and Packages.
Package compatibility changes, so check current installation guidance for the Python and data-library versions you plan to use. The supplied research does not establish which current versions of every data-science package work with the newest Python release; avoid assuming that a book’s older setup instructions are current. The official Python tutorial is also worth reading with its audience in mind: it assumes some basic programming knowledge, so an absolute beginner may want a gentler introduction first.
2. Learn the Python fundamentals you will use in analysis
Data work involves more than calling library functions. You will need to read values, make decisions, repeat operations, organize code, and investigate errors. Build a working understanding of these concepts before trying to automate a complicated analysis.
- Variables and basic types: store and work with numbers, text, and Boolean values.
- Collections: understand lists and dictionaries, and learn how to access and update their contents.
- Conditionals: use
ifstatements to handle different cases. - Loops: repeat an operation when it is useful, while recognizing that data libraries often provide more direct operations for whole columns or arrays.
- Functions: give a task a clear name, accept inputs, and return a result you can reuse.
- Modules and packages: understand how to import functionality and keep a project’s dependencies organized.
- Errors and debugging: read error messages, identify which step failed, and test a smaller example.
A useful readiness check is whether you can write a small function, use a loop or conditional when appropriate, and explain what your code is doing. You do not need advanced object-oriented programming or sophisticated algorithms before beginning basic tabular analysis.
For a structured introduction to programming concepts before focusing on data libraries, Learn Python Programming for Beginners covers foundations such as variables, functions, files, and loops, with practice projects listed in the catalog. It may suit readers who want a fundamentals-first resource.
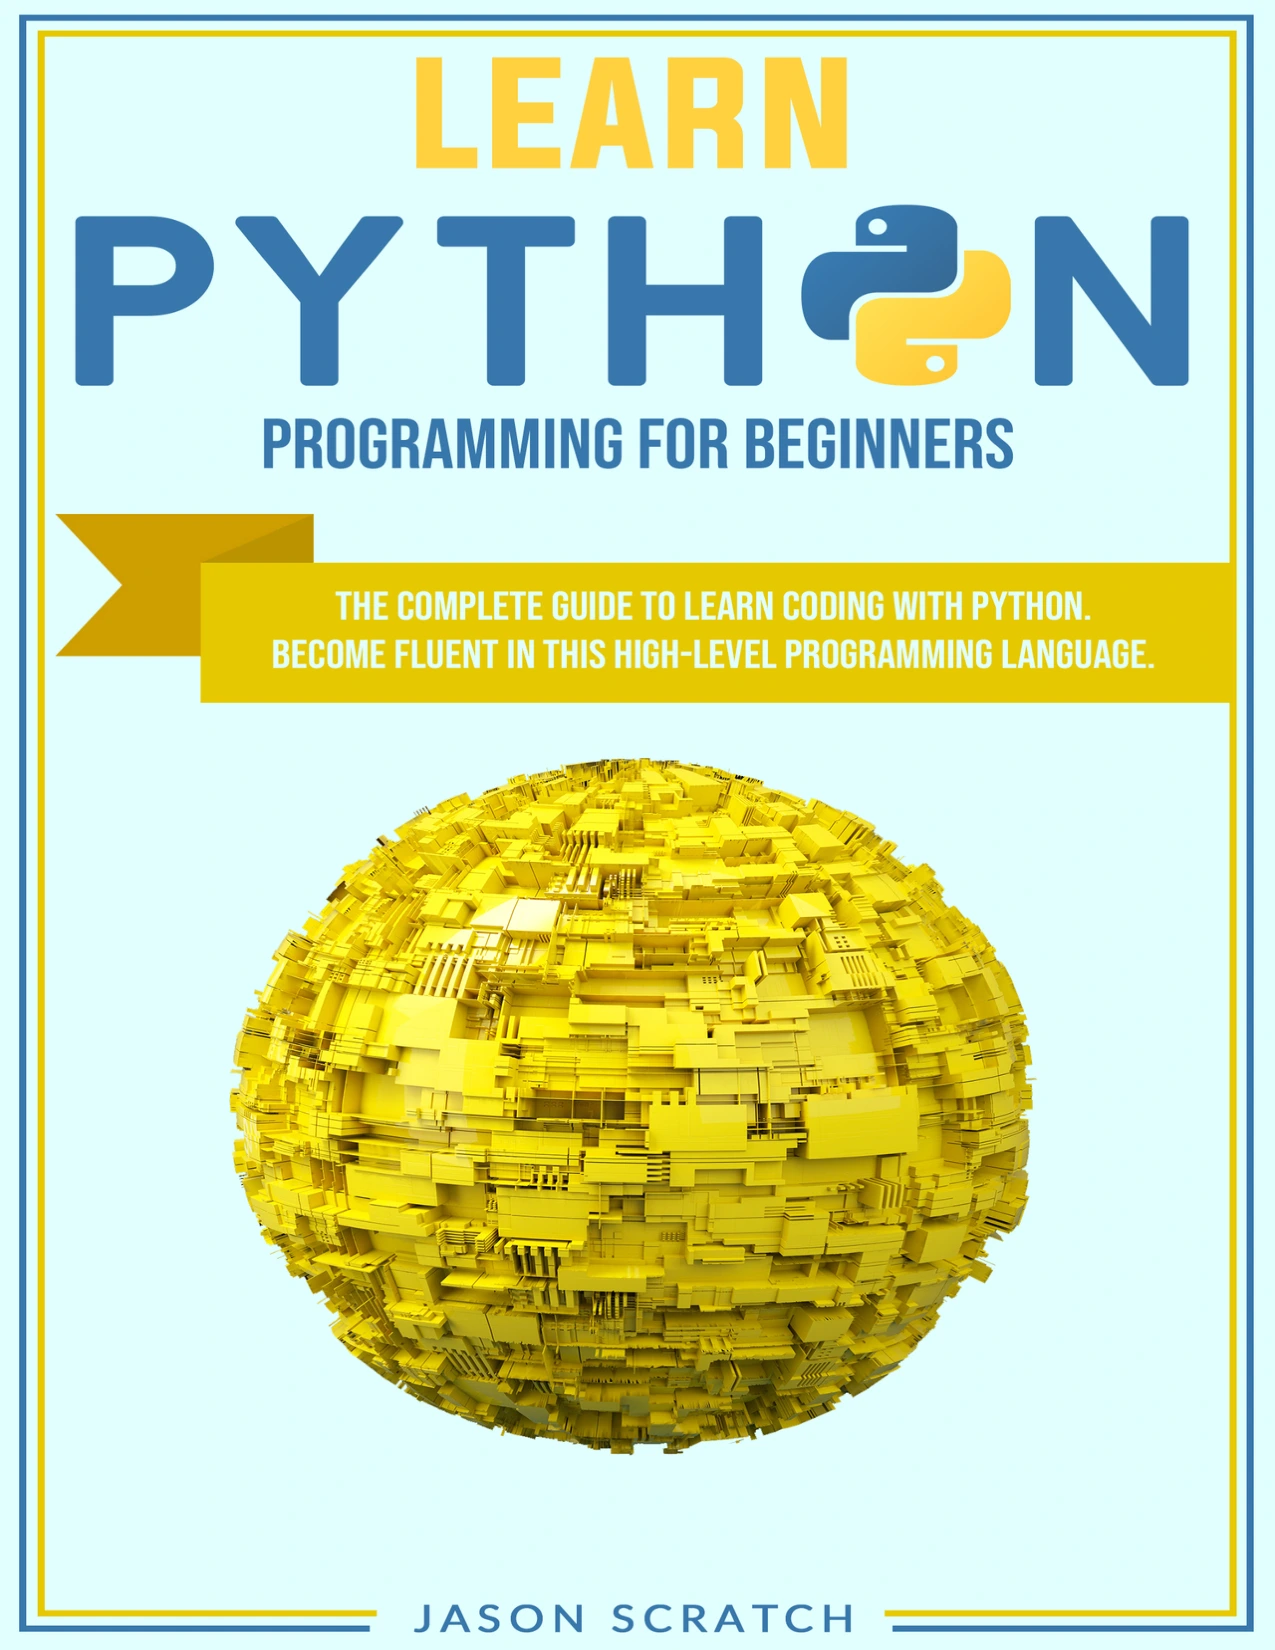
Readers who want to practise Python basics such as variables, functions, files, and loops.
3. Add the core data tools: NumPy, pandas, and plotting
Move into data libraries once you can follow basic Python code. You can learn the tools as you need them; there is no requirement to master an entire library before analysing a small dataset.
NumPy: numerical arrays
NumPy provides array-oriented tools for numerical work. Learn the basics of creating arrays, selecting values, checking shapes, and performing operations across an array. Those ideas help you understand how Python represents and operates on groups of numerical values.
pandas: tables and data wrangling
pandas is commonly used for working with labeled, table-shaped data. Start with its basic data structures and practise reading a file, inspecting rows and columns, selecting data, handling missing values, grouping records, and combining tables. Learn each operation in the context of a question rather than trying to memorize a catalogue of methods.
Plotting: make patterns easier to inspect
A plot can help you notice distributions, comparisons, trends, and unusual values. Begin with a small set of chart types that match your questions—for example, a histogram to inspect a numeric distribution or a bar chart to compare categories. A chart is evidence to interpret, not a conclusion by itself.
For a data-focused introduction that includes NumPy, pandas, visualization, and machine-learning basics, the catalog lists Python for Data Science: After work guide to start learning Data Science on your own. Its listed contents make it a possible bridge for learners who already want to connect Python with data tools.
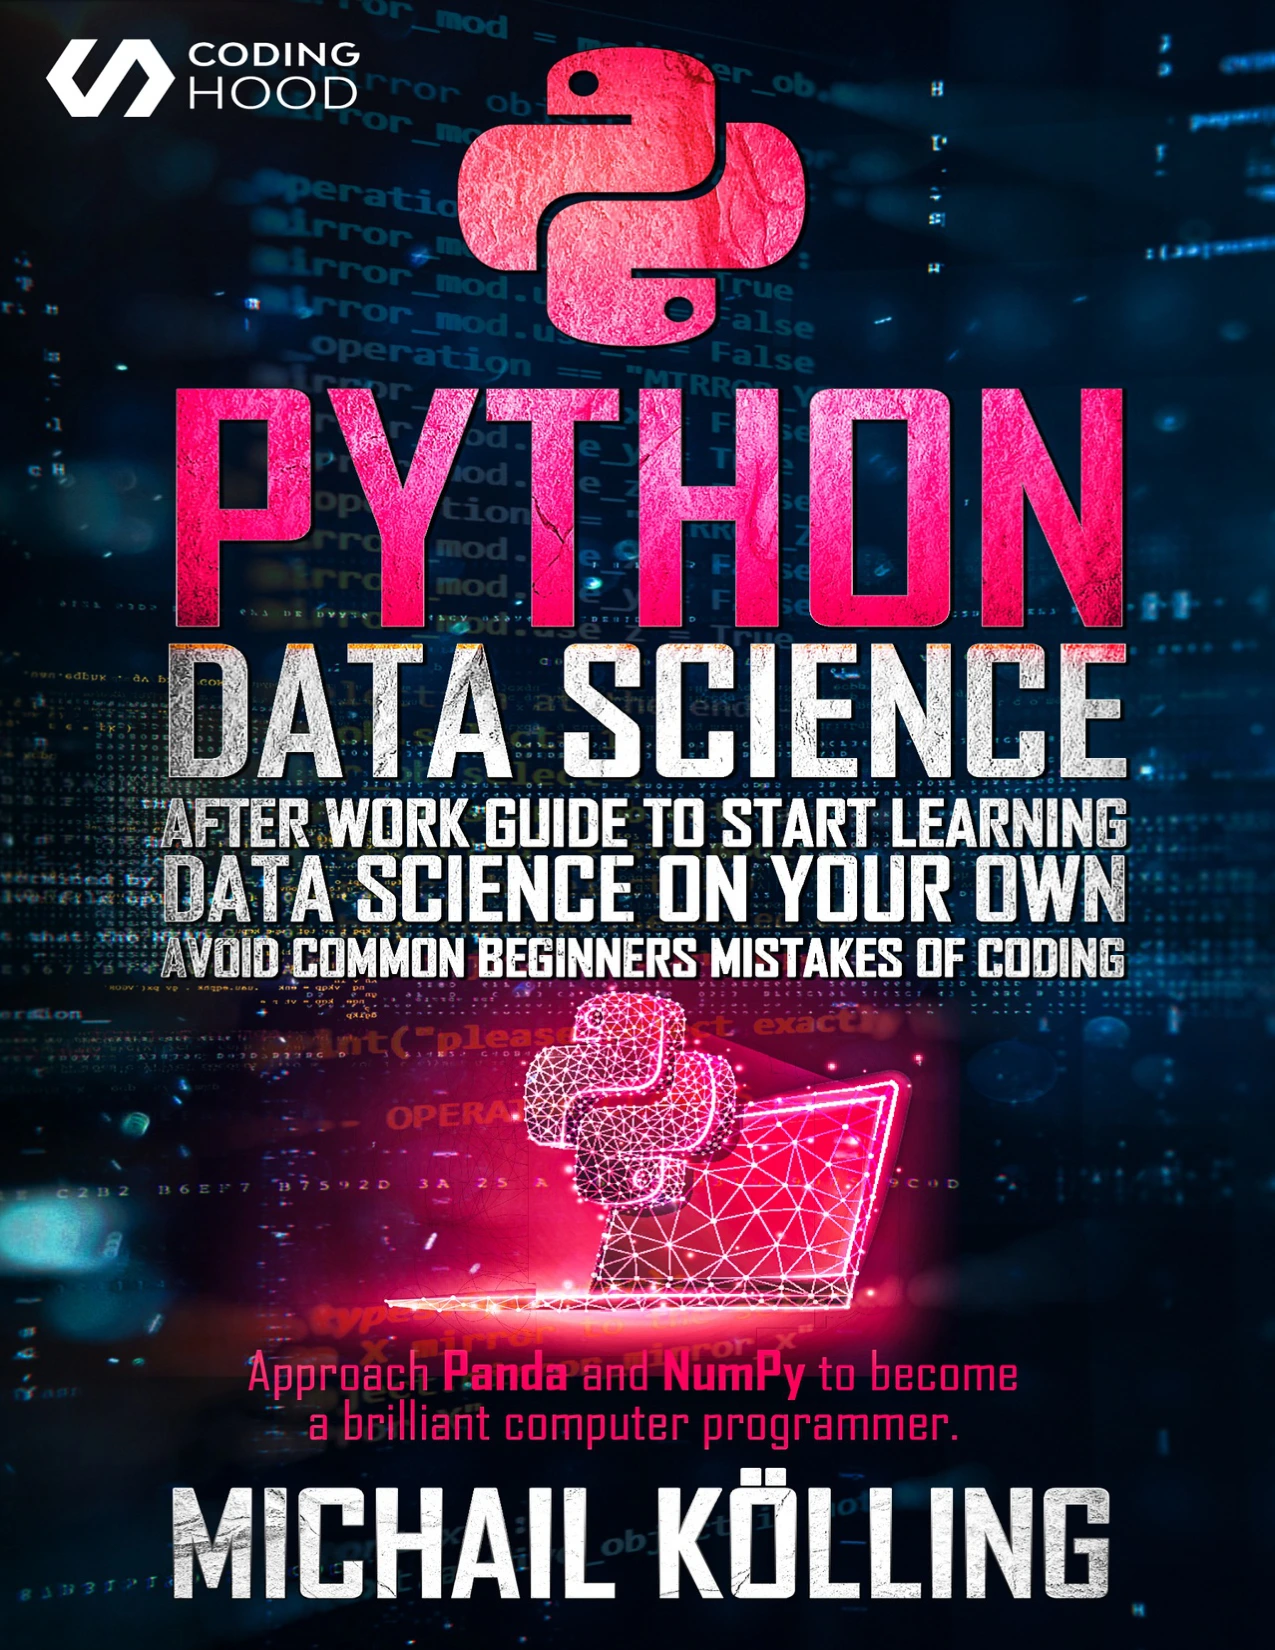
Learners looking for introductory material on NumPy, pandas, Matplotlib, and machine-learning basics.
4. Follow a repeatable data-analysis workflow
Good analysis is a sequence of decisions, not just a chain of code. A repeatable workflow helps you see where assumptions enter and makes it easier to revisit your work.
- State the question. Make it specific enough to guide what data you need. For example: “How did monthly sales vary across product categories?”
- Identify and load the data. Record where the data came from and use an appropriate reader for its format.
- Inspect before changing anything. Check the column names, data types, number of rows, representative values, and possible missing or duplicated records.
- Clean with a reason. Decide how to handle missing values, inconsistent labels, duplicates, and values that do not fit the question. Write down consequential choices instead of silently discarding information.
- Select, combine, and summarize. Filter relevant rows, join sources when needed, and calculate summaries that answer the original question.
- Visualize and check. Use a plot to inspect the result and look for patterns or exceptions. Check whether the visual encodes the values clearly and whether the data supports the interpretation.
- Communicate the result and its limits. Explain what you found, how you reached it, and what the dataset cannot tell you.
This progression—from loading and inspecting data to cleaning, reshaping, summarizing, and plotting—is also reflected in the topics listed for the third edition of Python for Data Analysis. The publisher describes that edition as updated for Python 3.10 and pandas 1.4, so use it for concepts rather than assuming its installation details match your current setup.
5. Build one small end-to-end project
After practising individual operations, use them together on a dataset small enough to understand. Choose data that interests you and has a clear source. A public dataset, a personal log you are comfortable using, or a simple file you create yourself can all work; the right choice depends on the question and whether the data is suitable to share.
For a first project, try a question such as “Which categories account for the most records in this dataset?” or “How does a measured value vary over time?” Then work through these steps:
- Write the question in one or two sentences.
- Note the dataset’s source, relevant fields, and any known limitations.
- Load the data and inspect its structure before cleaning.
- Choose one or two cleaning decisions and record why you made them.
- Use pandas to filter or group the data and calculate a summary.
- Create one plot that helps answer the question.
- Write a brief conclusion that distinguishes observation from interpretation.
Keep the work understandable: use descriptive names, separate distinct steps, and add short notes where a decision might otherwise be unclear. A project is useful when it helps you connect separate operations into a complete piece of analysis. The supplied sources do not establish a particular learning outcome or ideal project dataset, so treat this as a practical exercise rather than a guaranteed shortcut.
If your next difficulty is preparing a dataset rather than learning basic syntax, Hands-On Data Preprocessing in Python covers topics such as cleaning, integration, reduction, and transformation with Python examples. Its scope is a focused follow-on for learners ready to study data preparation in more depth, rather than a first introduction to programming.
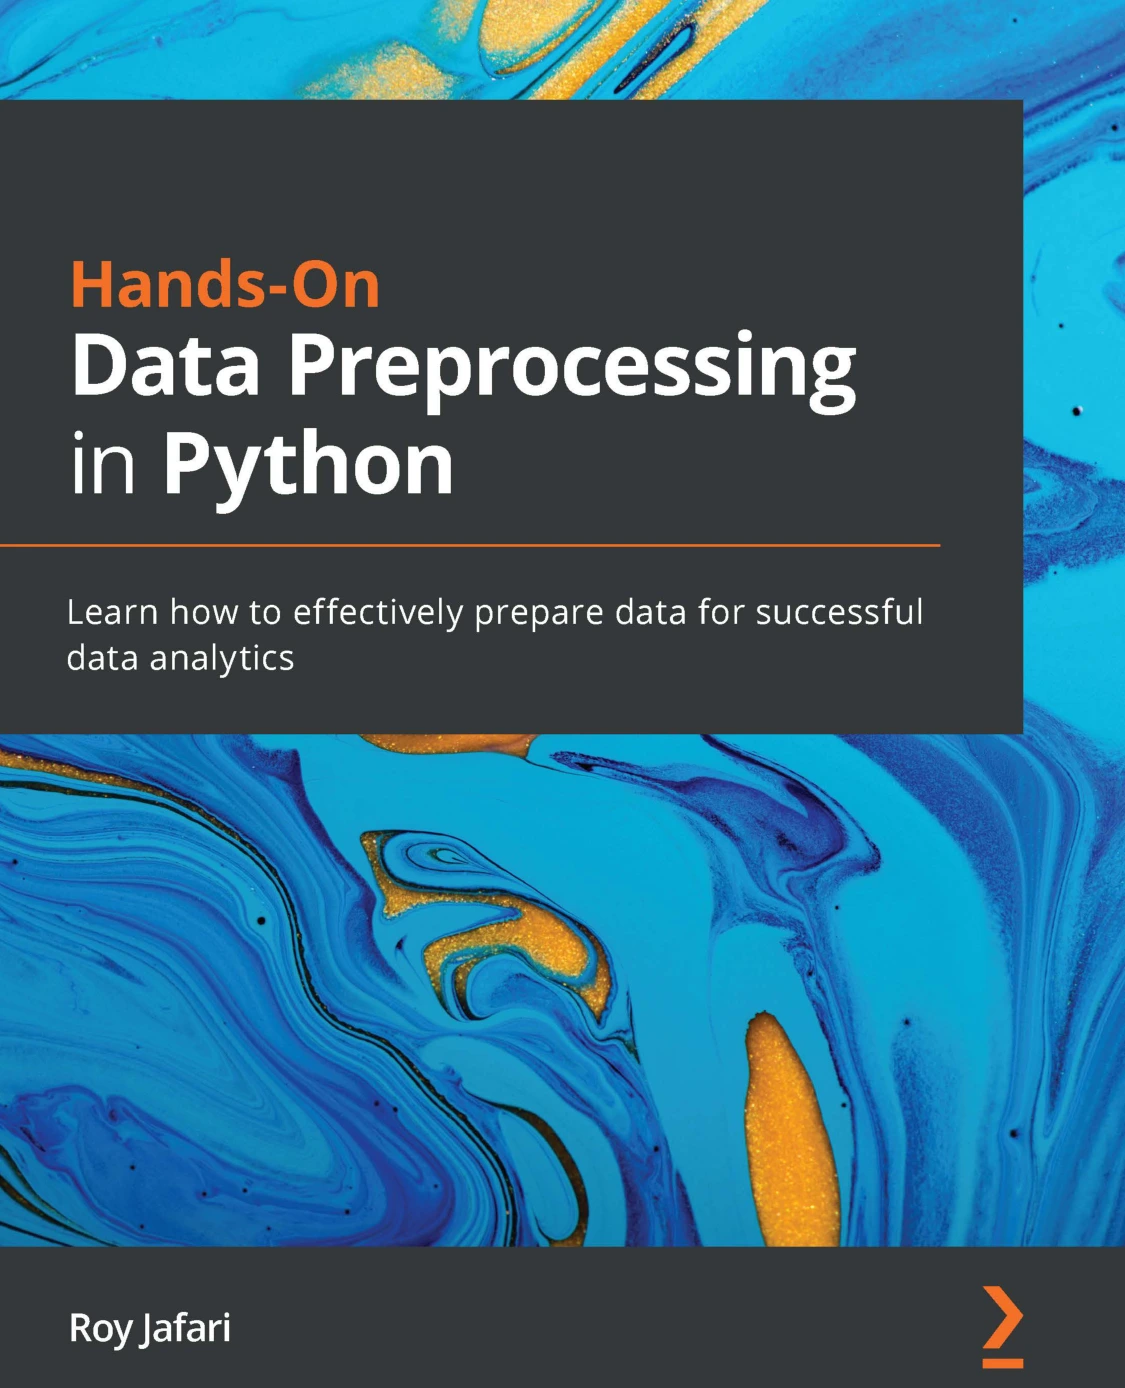
By Roy Jafari
Readers ready to study cleaning, integration, reduction, and transformation in greater depth.
Common beginner pitfalls to avoid
- Skipping programming fundamentals. You may be able to copy a pandas command, but basic Python knowledge helps you understand inputs, outputs, and errors.
- Copying code without testing your understanding. Change a small part, predict what should happen, and run it on a simple example.
- Cleaning data without recording decisions. Removing rows or changing values can affect the result. Keep track of what changed and why.
- Trying to learn every library at once. Begin with the tools your question requires. Add more when a real task calls for them.
- Treating a chart as proof. Check the underlying data, the scale, and alternative explanations before making a claim.
- Choosing a resource only because it promises speed. Compare what its contents actually cover with the skill you need to practise next.
Which learning resource should you choose?
Choose based on your current gap. A programming introduction is more appropriate if variables and functions are still unfamiliar. A data-focused guide makes more sense once you can read basic Python and want to work with datasets. A preprocessing reference can help later when cleaning and transforming data become the main challenge.
| Your current need | Catalog resource | Why it may fit |
|---|---|---|
| Learn Python foundations before data libraries | Learn Python Programming for Beginners | The catalog lists variables, functions, file handling, loops, and practice projects. |
| Connect Python basics with data science tools | Python for Data Science: After work guide to start learning Data Science on your own | Its listed topics include NumPy, pandas, Matplotlib, and introductory machine learning. |
| Study data preparation in greater depth | Hands-On Data Preprocessing in Python | Its catalog description covers data cleaning, integration, reduction, and transformation; it is better suited as a focused follow-on than a first coding lesson. |
These are options based on the topics stated in the catalog, not rankings or claims that one title is best for every learner. For a broader selection, browse the Digital Delights Data Analysis category.
Frequently asked questions
Do I need programming experience to learn Python for data analysis?
No, but it helps to separate “new to data analysis” from “new to coding.” If you have never programmed, learn basic variables, collections, conditionals, loops, and functions first. The official Python tutorial assumes basic programming knowledge, so it may not be the easiest first resource for every absolute beginner: Python Tutorial.
When should I start using pandas?
Start once you can follow basic Python expressions, access values in collections, and work with simple functions. You can begin with small tables and learn pandas operations as a question requires them; there is no need to finish an advanced Python course first.
Should I use a notebook or a code editor?
Either can be useful. Notebooks support interactive exploration, while scripts can make a sequence of steps easier to rerun. Try the format that helps you understand and reproduce your work, and avoid treating this choice as a prerequisite to learning analysis.
What should I learn after my first data-analysis project?
Review what slowed you down. You might practise cleaning and combining data, learn more plotting, improve your use of functions, or explore a relevant subject such as statistics. Choose the next topic based on a concrete limitation in your project rather than attempting to study every data-science tool at once.
Do I need to use the newest Python version?
Use current installation guidance, but check that the packages and learning material you rely on support your chosen setup. The supplied research does not verify compatibility between the newest Python release and every current data-science package, so no specific version pairing is recommended here.
Conclusion: learn the workflow, not just the commands
A practical route into Python for data analysis is to build enough Python fluency to understand your code, learn NumPy and pandas as needed, and practise a complete workflow on a manageable dataset. Inspect data before changing it, record important decisions, and explain the limits of your conclusions. Once you know which part of that process you want to strengthen, choose a resource that addresses that particular gap.