

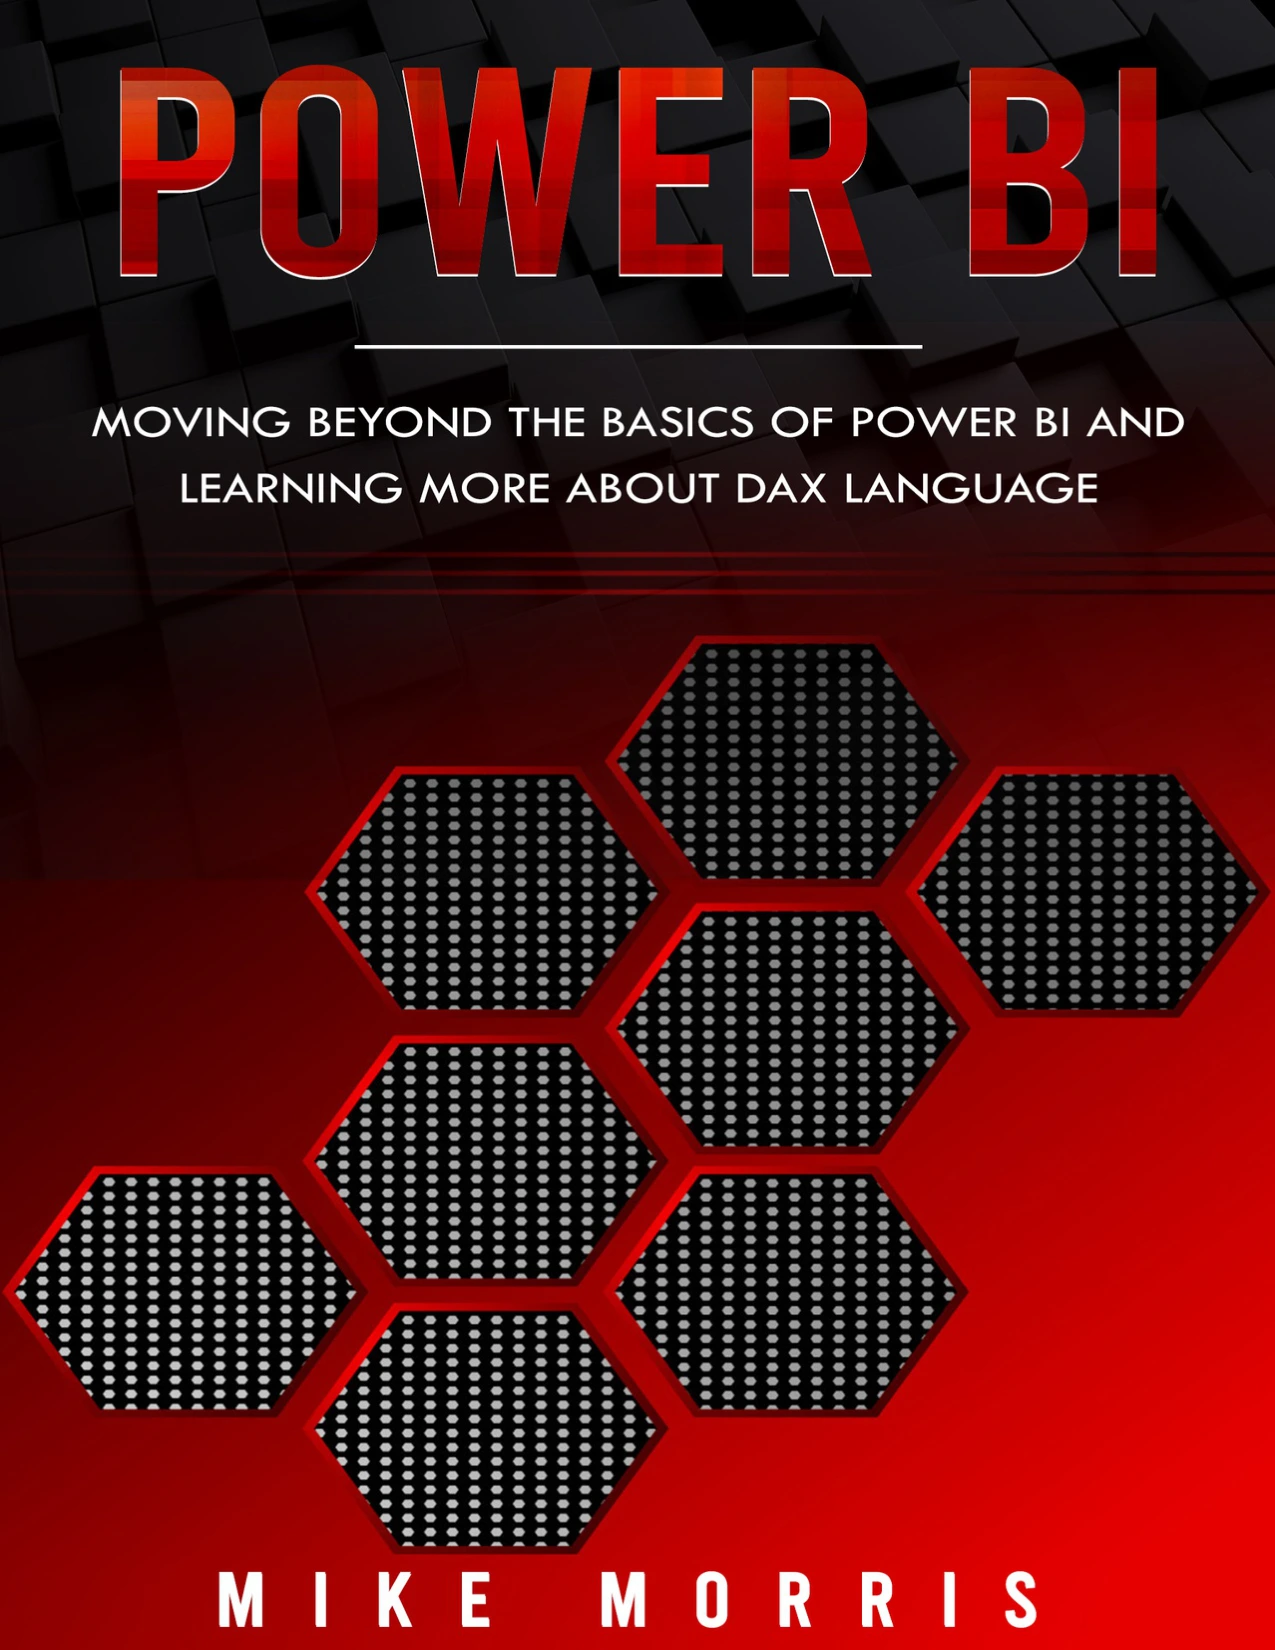
Power BI: Moving Beyond the Basics of Power BI and Learning More about DAX Language
Original price was: $5.00.$2.50Current price is: $2.50.

Mike Morris
Product Specs:
- File Type: PDF
- File Size: 2.1 MB
- Book Language: English
- Total Page Count: 146
- Instant Download
Power BI Beyond the Basics: Making Reports Do Real Work 📊
If you have opened Power BI, connected a file, and dropped a few fields onto a canvas, the next challenge is usually not the interface. It is learning how data modeling, dashboards, sharing, and DAX calculations fit together. Mike Morris writes for readers who want a structured route from foundational concepts into the parts of Power BI that make reports genuinely useful.
Published in 2020, the book moves from the platform’s origins and core components into the daily decisions that shape a working report: where data comes from, how it is modeled, how calculations are written, and how dashboards are shared with others.
From Data Sources to Dashboards
Early chapters explain what Power BI is, how it grew out of Microsoft’s self-service business intelligence tools, and what its main components and connection types do. The book then covers data sources, the choice between Import and DirectQuery, and comparisons with Tableau and SSRS. Later material turns to data modeling, calculated columns and tables, time-based data, dashboard creation, tiles, gateways, and sharing.
DAX: The Calculation Language at the Center 🧠
A substantial portion of the book is devoted to DAX. It introduces the language, explains why it matters in Power BI, and outlines calculation types, parameter naming, and the standard way DAX functions are described. The function sections are organized into aggregate functions, filter functions, and time intelligence functions, giving readers a clearer map through a language that can otherwise feel intimidating.
Visualization and Report Design
Visualization chapters move through simple and map visualizations, combination charts, tables, color adjustments, images, shapes, text boxes, styling, and report duplication. Sharing options are also covered, including using Power BI Desktop, printing, exporting, publishing reports to the web, and working with content packs.
Practical Tips for Clearer Analysis ⚙️
The closing advice centers on clarity: keep visualizations simple, identify the context behind the data, slice, dice, and filter thoughtfully, use hierarchies, and think about the message the report is meant to communicate. These tips connect the technical tools back to the reason someone opens Power BI in the first place—to help others understand what the data is saying.
Who This Book Is For
This title is best suited to readers who have some initial exposure to Power BI and want to strengthen their grasp of data modeling, dashboards, and DAX. Analysts, Excel users, students, and business intelligence practitioners looking for a focused next step will find the structure useful, while complete beginners may want to pair it with introductory material.
User Reviews
Only logged in customers who have purchased this product may leave a review.
Original price was: $5.00.$2.50Current price is: $2.50.


There are no reviews yet.