

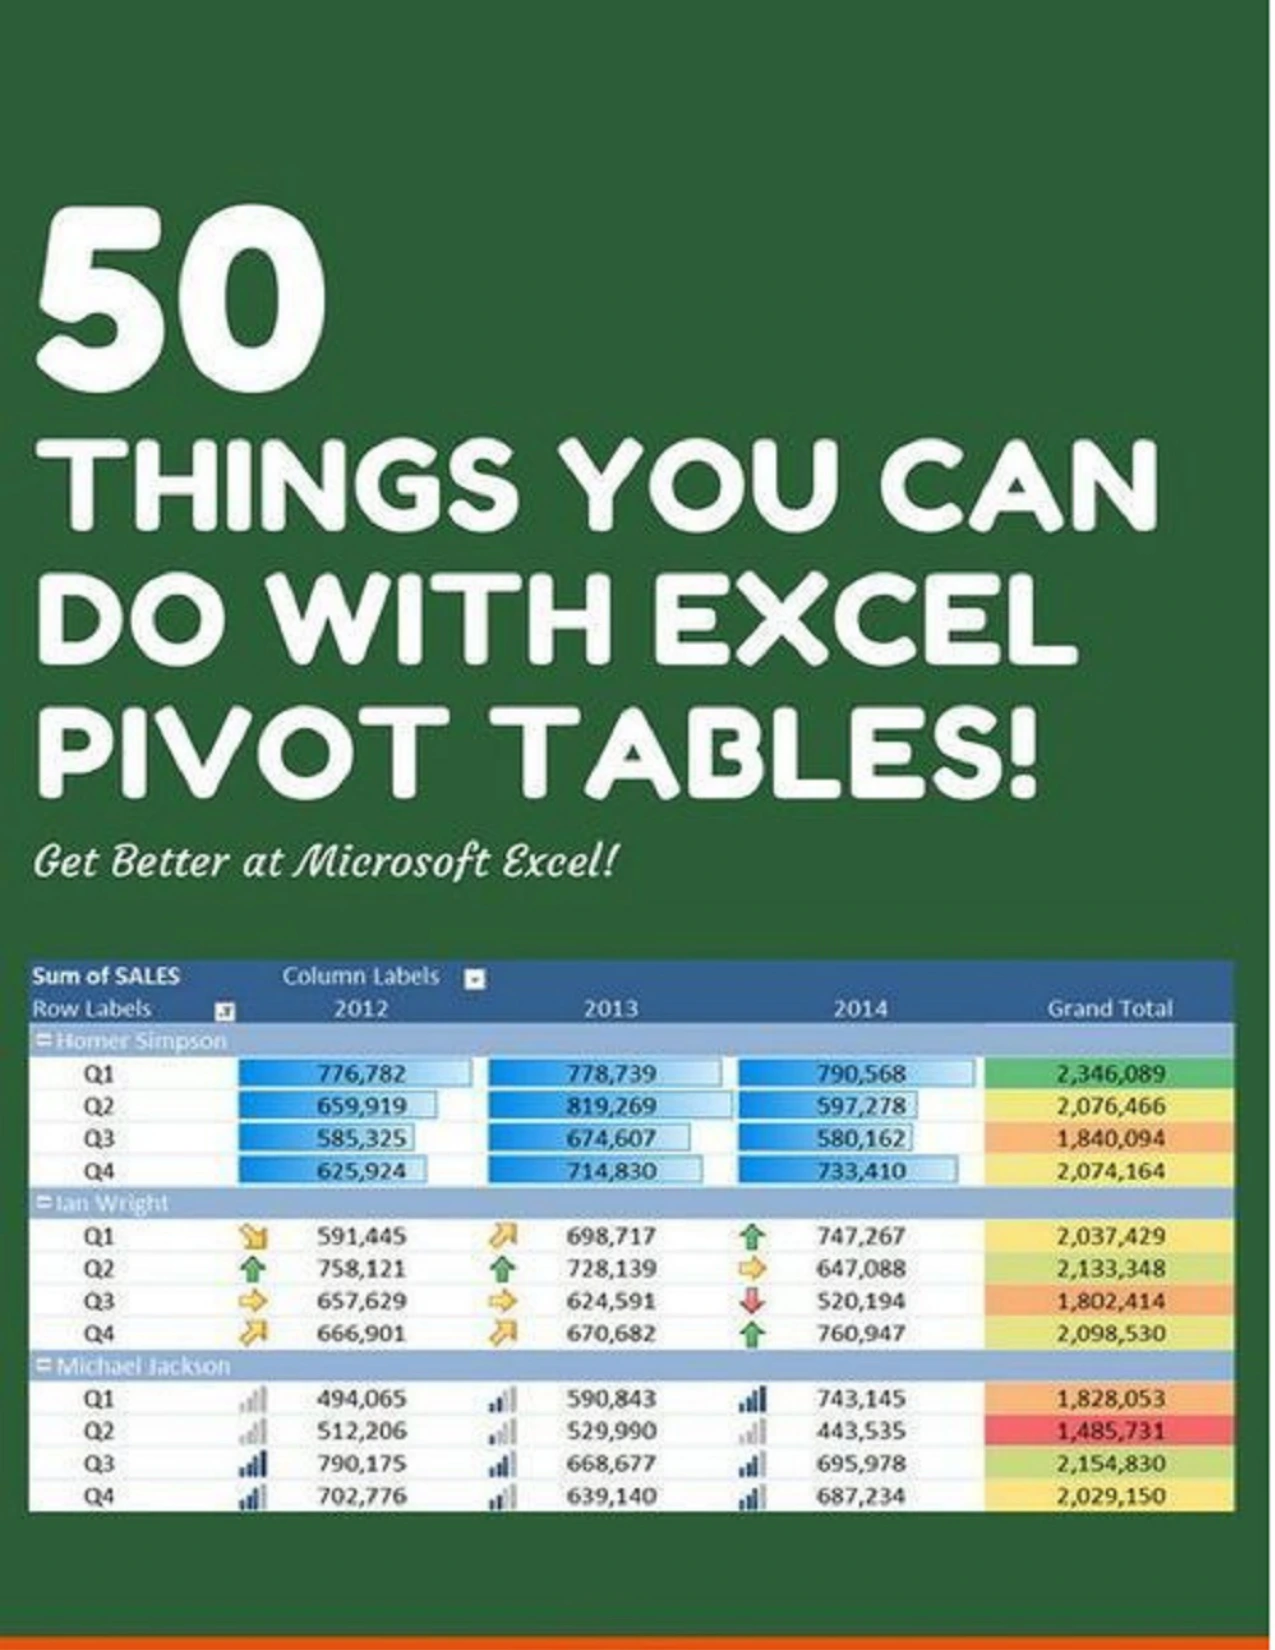
50 Things You Can Do With Excel Pivot Table
Original price was: $201.00.$100.00Current price is: $100.00.

Mr. Alisha
Product Specs:
- File Type: PDF
- File Size: 33.3 MB
- Book Language: English
- Total Page Count: 127
- Instant Download
50 Things You Can Do With Excel Pivot Table is a practical, hands-on guide to one of Microsoft Excel’s most useful features. It focuses on Pivot Tables as a fast way to summarize data, spot patterns, and build reports that are easier to read and present.
The opening pages explain the basic purpose of a Pivot Table and introduce a step-by-step tutorial structure. From there, the material moves into everyday tasks such as building a table, inserting a Pivot Table, drilling down into underlying records, and refreshing results when source data changes. The table of contents also points to a wider range of topics, including formatting, sorting, grouping, slicers, calculated fields, Pivot Charts, and conditional formatting.
What the guide covers
- Creating tables and inserting Pivot Tables
- Exploring and auditing summarized data
- Refreshing and reorganizing reports
- Using slicers, charts, and calculated fields
- Applying formatting and filtering techniques
Why it stands out
This is a workflow-oriented Excel tutorial rather than a theory-heavy manual. The material is aimed at readers who want practical ways to work faster with spreadsheet data and get more value out of Excel reporting tools.
Ideal for
Excel users, office professionals, analysts, managers, and anyone looking to strengthen their Pivot Table skills with a guided set of real-world techniques.
User Reviews
Be the first to review “50 Things You Can Do With Excel Pivot Table”
You must be logged in to post a review.
Original price was: $201.00.$100.00Current price is: $100.00.






There are no reviews yet.