

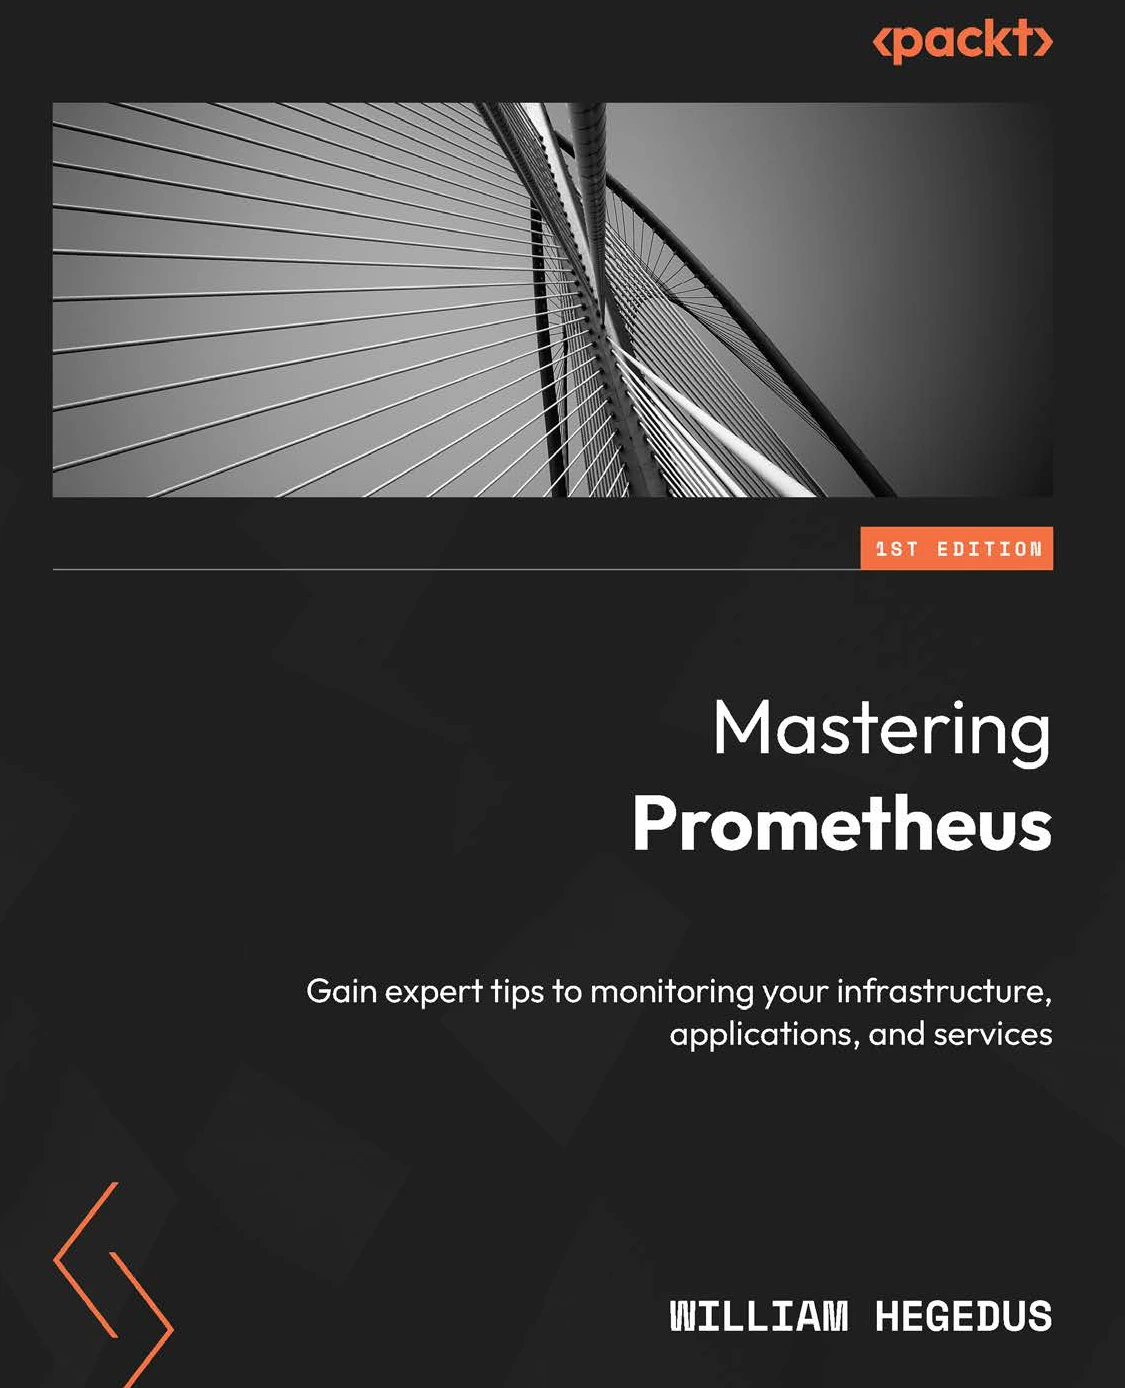
Mastering Prometheus: Gain expert tips to monitoring your infrastructure, applications, and services
Original price was: $5.00.$2.50Current price is: $2.50.

William Hegedus
Product Specs:
- File Type: PDF
- File Size: 4.7 MB
- Book Language: English
- Total Page Count: 310
- Instant Download
Monitoring That Keeps Up With Modern Infrastructure 💻
Prometheus has become the default monitoring and alerting toolkit for cloud-native infrastructure, but mastering it goes beyond installing a server and scraping a few metrics. Mastering Prometheus by William Hegedus draws on years of running large-scale Prometheus fleets to show how the pieces fit together—and how to keep them working under real production pressure.
Hegedus, an SRE who has managed a global fleet of Prometheus servers ingesting millions of data points per second, writes for engineers who need more than a quick start. The book moves from core concepts to advanced scaling patterns, always with an eye on the operational realities that determine whether observability actually helps when systems misbehave.
What the Book Covers 📊
The guide is organized in two parts. Part 1: Fundamentals of Prometheus establishes the why and how: observability signals, deployment, the Prometheus data model, PromQL, service discovery, and robust alerting. Part 2: Scaling Prometheus tackles the problems that appear as environments grow—sharding, federation, high availability, cardinality control, debugging, and performance tuning.
- Deploy Prometheus and understand the roles of Alertmanager, Node Exporter, and Grafana
- Work confidently with the TSDB, labels, samples, blocks, and the WAL
- Write effective PromQL queries using operators, functions, and recording rules
- Discover targets across cloud providers and custom HTTP service-discovery endpoints
- Build alerting that is reliable, maintainable, and tested
- Address cardinality, long-term storage, sharding, and HA architectures
- Debug performance with pprof, query logging, limits, and GOMEMLIMIT
PromQL, Alerting, and the Data Model
PromQL is where Prometheus becomes genuinely powerful, and the book gives it serious attention. Rather than presenting a disconnected list of functions, it explains how the data model shapes query behavior. That foundation helps readers understand why some queries are efficient, why others explode in cost, and how to write expressions that stay useful as the system evolves.
Alerting receives similar treatment. Hegedus covers routing, receivers, inhibition, templates, and HA alerting, but the real value is in the guidance on making alerts robust. Topics such as appropriate for durations, _over_time functions, and unit testing turn alerting from a source of noise into a dependable operational signal.
Scaling, Debugging, and the Reality of Production ⚙️
Many Prometheus guides stop before the hard parts. This one continues into sharding by service or relabeling, federating Prometheus, achieving high availability, and controlling cardinality before it becomes a crisis. The debugging chapter is especially practical, covering pprof, query logging, query limits, garbage collection tuning, and GOMEMLIMIT.
Because the author writes from direct experience with large, multi-datacenter deployments, the advice stays grounded. The book does not promise that a single Prometheus server will handle every workload. Instead, it helps readers recognize the trade-offs and choose patterns that match their scale, reliability needs, and team capacity.
Who Will Get the Most From It 🧠
Mastering Prometheus suits site reliability engineers, DevOps practitioners, platform engineers, system administrators, and developers who already have some exposure to monitoring or cloud-native tooling. It is also a strong fit for teams standardizing their observability stack around Prometheus, Alertmanager, Grafana, and related CNCF projects.
If you are completely new to metrics or Linux, the book assumes a degree of technical comfort, but its progression from fundamentals to advanced scaling means it can serve both as a structured learning path and as a reference to revisit when specific operational problems arise.
A Practical Guide for Engineers Who Run the Stack
What sets this book apart is its focus on the decisions that matter after the initial setup: how to keep cardinality under control, when to shard, how to test alerts before they wake someone at 3 a.m., and how to debug a Prometheus instance under load. For engineers responsible for keeping observability systems healthy, Mastering Prometheus is a detailed, experience-driven resource.
User Reviews
Be the first to review “Mastering Prometheus: Gain expert tips to monitoring your infrastructure, applications, and services”
You must be logged in to post a review.
Original price was: $5.00.$2.50Current price is: $2.50.






There are no reviews yet.