

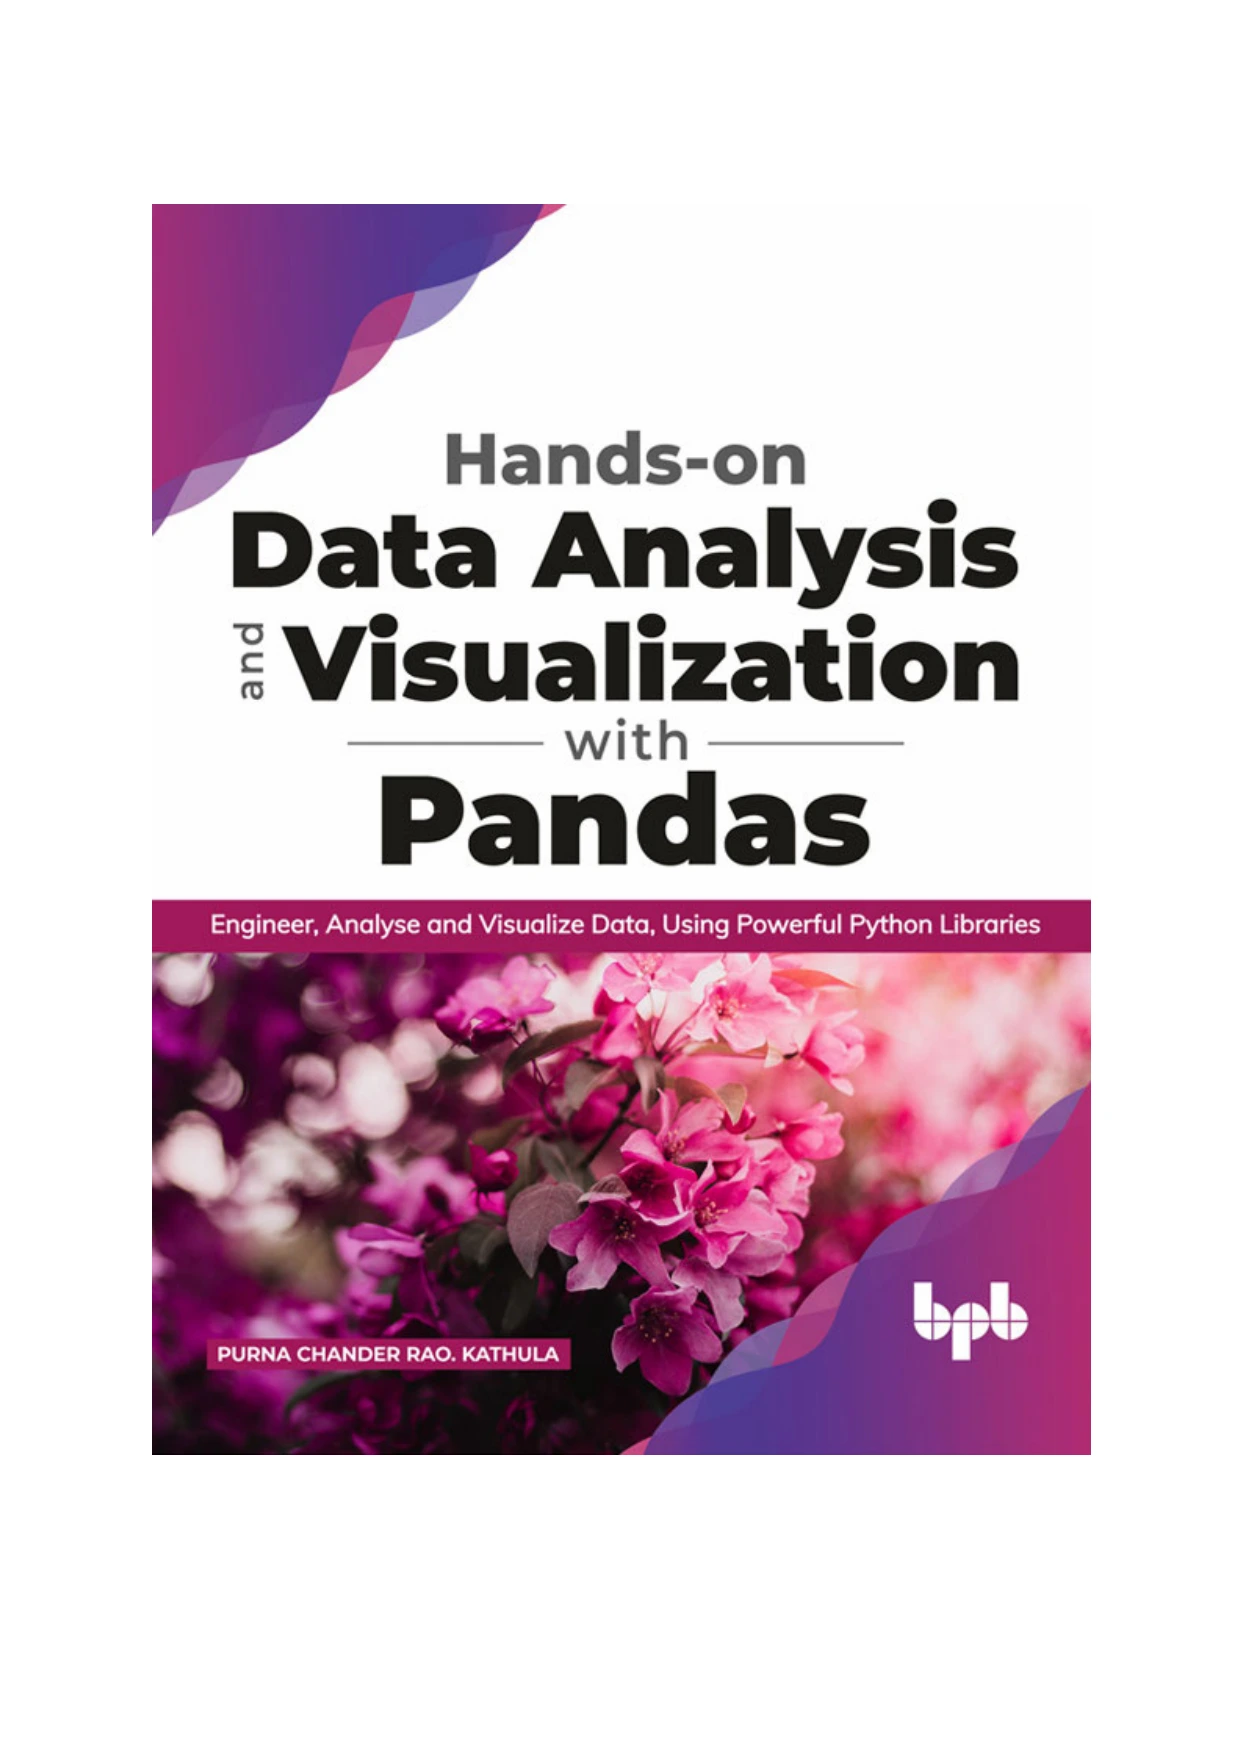
Hands-on Data Analysis and Visualization with Pandas: Engineer, Analyse and Visualize Data, Using Powerful Python Libraries
Original price was: $5.00.$2.50Current price is: $2.50.

Purna Chander Rao Kathula
Product Specs:
- File Type: PDF
- File Size: 17.1 MB
- Book Language: English
- Total Page Count: 610
- Instant Download
Turning raw data into a useful view of what is happening takes more than a plotting library. Hands-on Data Analysis and Visualization with Pandas follows that work across the Python ecosystem—from preparing data and handling DataFrames to statistical analysis, time-series exploration, and visual communication.
Purna Chander Rao Kathula’s 11-chapter guide brings together JupyterLab, NumPy, Pandas, SciPy, Matplotlib, and Seaborn. It combines programming foundations with practical analysis topics, giving readers a connected view of how these tools fit into a data workflow.
From Python foundations to data work
The opening chapters introduce data analysis, JupyterLab, and Python concepts used throughout the book. Functions, lambdas, list comprehensions, data containers, and datetime objects provide useful grounding for manipulating and organizing information.
Work with data using NumPy and Pandas
Coverage of NumPy arrays leads into Pandas Series and DataFrames, cleaning and reorganizing data, and combining data for analysis. The book also discusses handling larger datasets, including memory-conscious data types, reading data in chunks, and tools such as Dask and Modin.
Explore patterns, time, and statistics
Chapters on data analysis and time-series analysis are followed by an introduction to statistics. Topics include measures of central tendency, confidence intervals, hypothesis testing, and the central limit theorem. Together, these subjects help readers examine relationships and trends in data rather than relying on charts alone.
Make findings visible 📊
Matplotlib and Seaborn round out the toolset, with attention to plotting, chart choices, and exploratory data analysis. The book discusses using visualizations to investigate variables and identify possible outliers or anomalies, with examples and datasets supporting the material.
Who will find it useful?
This book is intended for readers who want to use Python for data analysis and visualization. It can suit newcomers to the subject as well as readers building on existing Pandas experience; basic Python knowledge is a prerequisite. Its broad progression—from core programming ideas to analysis and visualization—makes it a practical reference for following the stages of a Python data workflow.
User Reviews
Be the first to review “Hands-on Data Analysis and Visualization with Pandas: Engineer, Analyse and Visualize Data, Using Powerful Python Libraries”
You must be logged in to post a review.
Original price was: $5.00.$2.50Current price is: $2.50.
There are no reviews yet.