

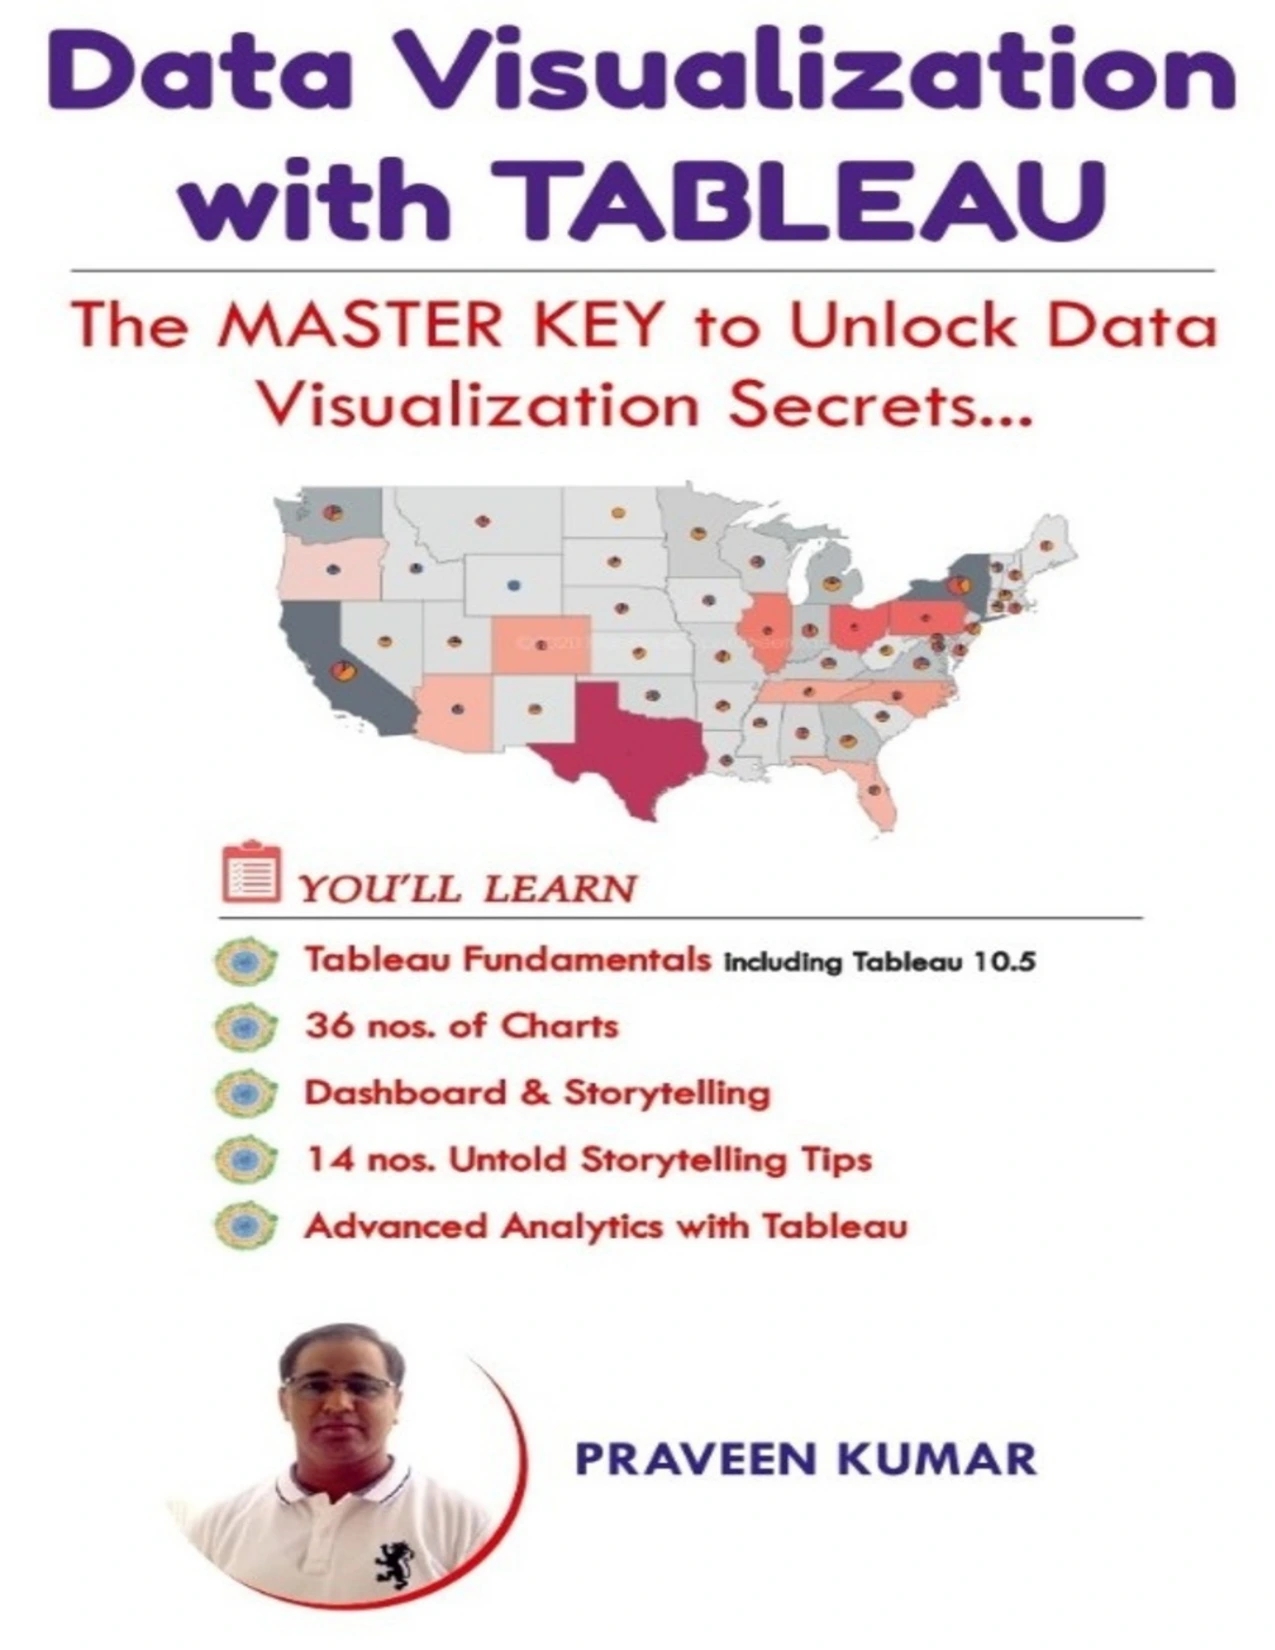
Data Visualization with TABLEAU: The MASTER KEY to Unlock Data Visualization Secrets
Original price was: $15.66.$7.83Current price is: $7.83.

Praveen Kumar
Product Specs:
- File Type: PDF
- File Size: 39.0 MB
- Book Language: English
- Total Page Count: 391
- Instant Download
Good data visualization is about more than choosing a chart. It is about shaping a dataset into a view that helps people notice patterns, understand a business question, and communicate what the findings might mean. Praveen Kumar’s Data Visualization with TABLEAU takes readers through that process, from getting familiar with Tableau to building dashboards and telling stories with visual evidence.
Start with the Tableau essentials
The opening chapter covers getting started, connecting to data, preparing a data source, and understanding key Tableau terms and interface features. It also addresses concepts such as dimensions, measures, marks, labels, tooltips, and level of detail—foundations that help make later chart-building decisions easier to follow.
Build charts, then tackle more advanced views
Across chapters on novice, advanced, and professional charts, the book moves from basic visualization techniques toward more demanding forms. Step-by-step tutorials connect chart creation to business questions, helping readers consider not just how a view is made, but what it can reveal.
Bring individual views together
Dashboards receive a dedicated chapter, with a focus on combining relevant workbooks into a single view of business insights. The following storytelling chapters turn to arranging visualizations and dashboards into a clearer narrative for stakeholders. A further chapter gathers additional storytelling tips for making those presentations more effective.
Explore analytics beyond chart-making
A bonus chapter introduces advanced analytics using Tableau, including integration with R, clustering, and time-series forecasting. This broadens the book’s scope from visual presentation toward analytical methods that can be represented through visualizations.
Who may find it useful?
The book is intended for a varied readership: students, Tableau users, data and business analysts, quality engineers, operations managers, IT specialists, decision-makers, and marketing professionals. Beginners can follow its progression from fundamentals, while readers with some experience may value the later material on dashboards, storytelling, and analytics.
For readers learning Tableau in a business context, this is a structured route from connecting data to presenting insights with greater purpose.
User Reviews
Only logged in customers who have purchased this product may leave a review.
Original price was: $15.66.$7.83Current price is: $7.83.


There are no reviews yet.