
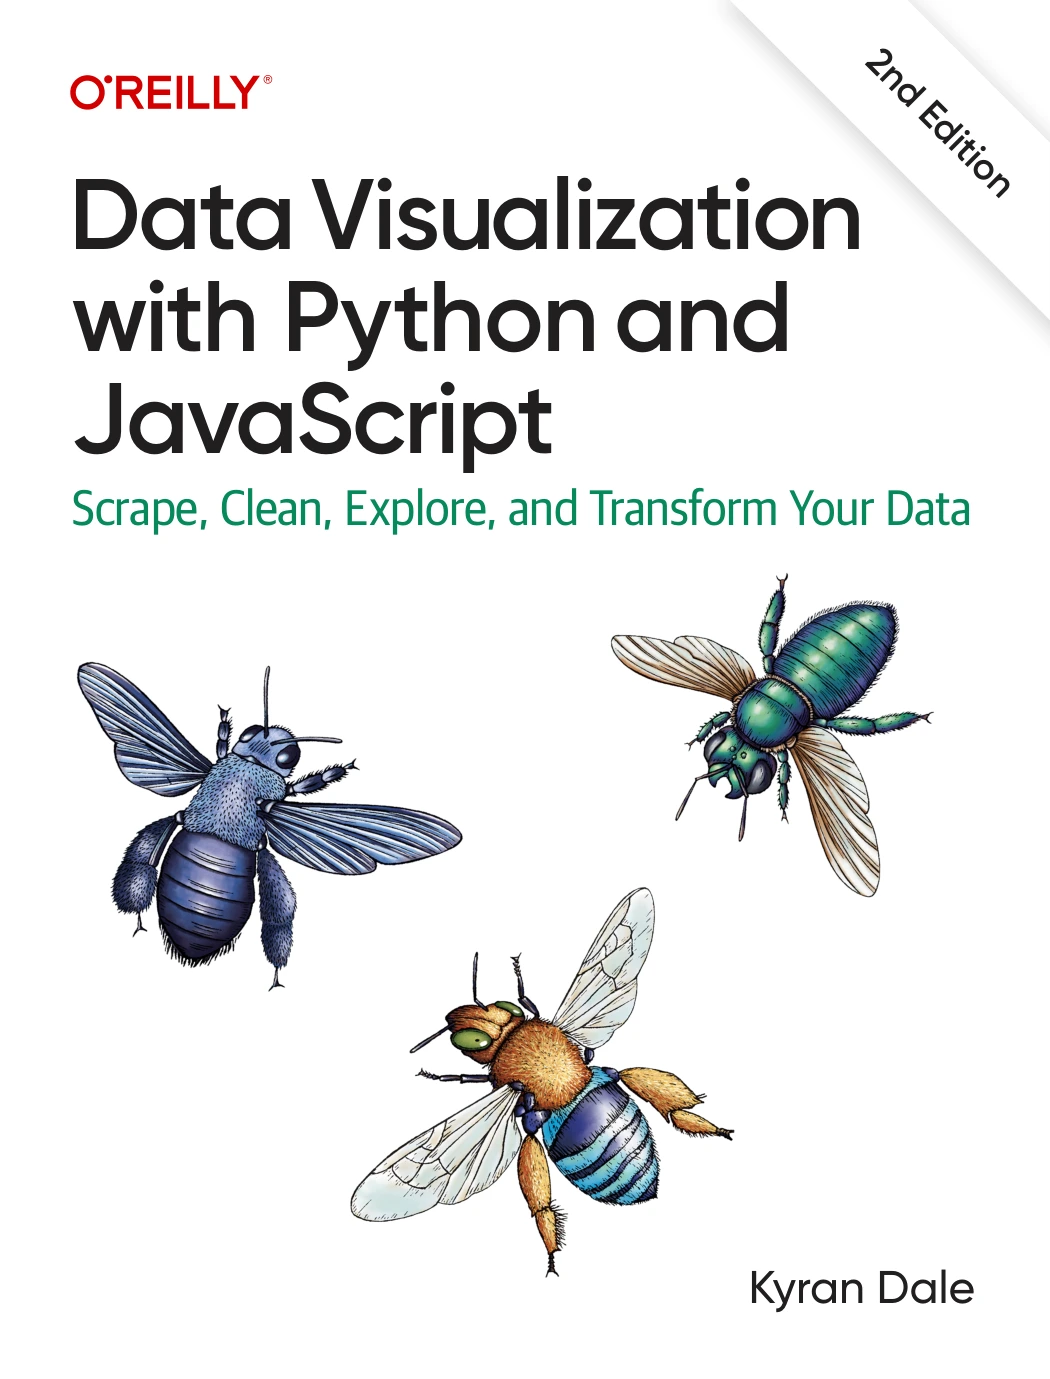
Data Visualization with Python and JavaScript: Scrape, Clean, Explore, and Transform Your Data (2nd Edition)
Original price was: $56.99.$28.50Current price is: $28.50.

Kyran Dale
Product Specs:
- File Type: PDF
- File Size: 21.2 MB
- Book Language: English
- Total Page Count: 569
- Instant Download
Raw data rarely arrives ready to tell a story. In Data Visualization with Python and JavaScript, Kyran Dale lays out a practical route from gathering and refining data to presenting it as an interactive web visualization. The central idea is a two-language toolkit: Python for data collection and analysis, JavaScript for bringing visualizations to life in the browser.
This second edition follows that process step by step, connecting libraries and techniques through a recurring example built around Nobel Prize data. It’s aimed at data scientists, analysts, and developers who want to understand how the pieces of a modern data-visualization workflow fit together.
Follow the data from source to screen
The book begins with development tools and a bridge between Python and JavaScript, then moves into gathering information from websites and APIs. Readers encounter Requests, Beautiful Soup, and Scrapy before moving on to data preparation and exploration with NumPy, pandas, Matplotlib, and Seaborn. The progression makes the work behind a polished chart visible: finding data, checking its quality, shaping it, and deciding what it can show.
Make the browser part of the toolkit
Once data is ready, the focus shifts to delivering it to the web and building visualizations there. The coverage includes web fundamentals, Flask-based delivery, and interactive charting with Plotly and D3. Along the way, the Python-and-JavaScript approach shows how each language can contribute to the stage it handles best.
A connected example, not a pile of disconnected tools
Nobel Prize data provides a through-line for the workflow, helping connect scraping, cleaning, analysis, and visualization into one applied project. That structure is useful for readers who want to see how individual libraries work together, rather than encounter them as isolated tutorials.
Who will find it useful?
Data scientists and analysts can use the book to explore a path from data acquisition to browser-based presentation. Python and JavaScript developers interested in data visualization will find a guided introduction to the complementary roles of both languages and the libraries used along the way.
For anyone building a web visualization, the key lesson is in the handoffs: from messy source material to usable data, and from analysis to an interactive view a browser can share.
User Reviews
Only logged in customers who have purchased this product may leave a review.
Original price was: $56.99.$28.50Current price is: $28.50.



There are no reviews yet.