

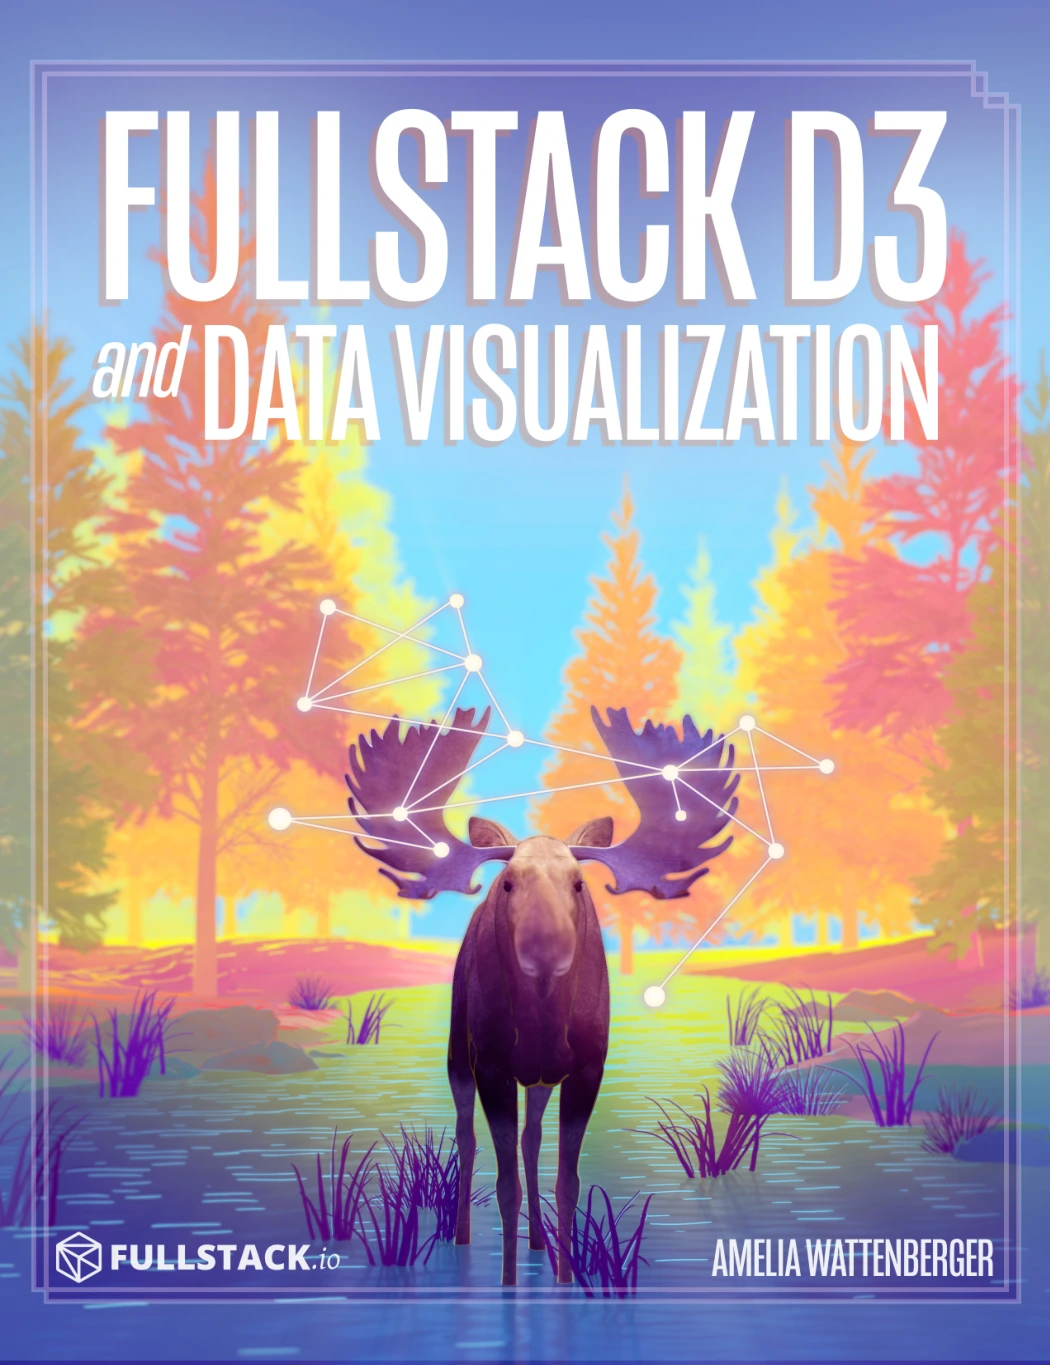
Fullstack Data Visualization with D3
Original price was: $129.00.$64.50Current price is: $64.50.

Amelia Wattenberger
Product Specs:
- File Type: PDF
- File Size: 57.0 MB
- Book Language: English
- Total Page Count: 605
- Instant Download
Good data visualization is part code, part design judgment. This practical guide brings the two together, walking through how to build custom charts with D3 and how to make those charts communicate clearly. It starts with a working chart early, then steadily expands the techniques and design decisions behind more involved visualizations.
Build charts one decision at a time
Examples progress through line charts, scatterplots, bar charts, scales, data joins, interaction, and animation. The step-by-step approach helps make the process legible: not just how to draw marks on screen, but how chart dimensions, data, and visual choices fit together.
From chart fundamentals to richer displays
Alongside the mechanics of D3, the book considers data visualization principles, including how to represent qualitative and quantitative data, choose chart forms, use color, and simplify a design. Later projects bring those ideas into dashboards and more complex visualizations, including marginal histograms, a radar weather chart, and an animated Sankey diagram.
Bring D3 into a web application
Dedicated sections explore working with D3 and React and with D3 and Angular. For developers building visualizations within an existing web workflow, these chapters connect chart-making techniques with familiar application frameworks.
A hands-on guide for JavaScript readers
The book is intended for readers who know JavaScript and want to create custom data visualizations. Its combination of working examples and design discussion makes it relevant to developers, analysts, and data communicators who want to turn numbers into charts people can understand.
For a first D3 project or a deeper exploration of interactive charts and dashboards, this guide offers a substantial, project-led path through the craft of data visualization. 📊
User Reviews
Be the first to review “Fullstack Data Visualization with D3”
You must be logged in to post a review.
Original price was: $129.00.$64.50Current price is: $64.50.






There are no reviews yet.