

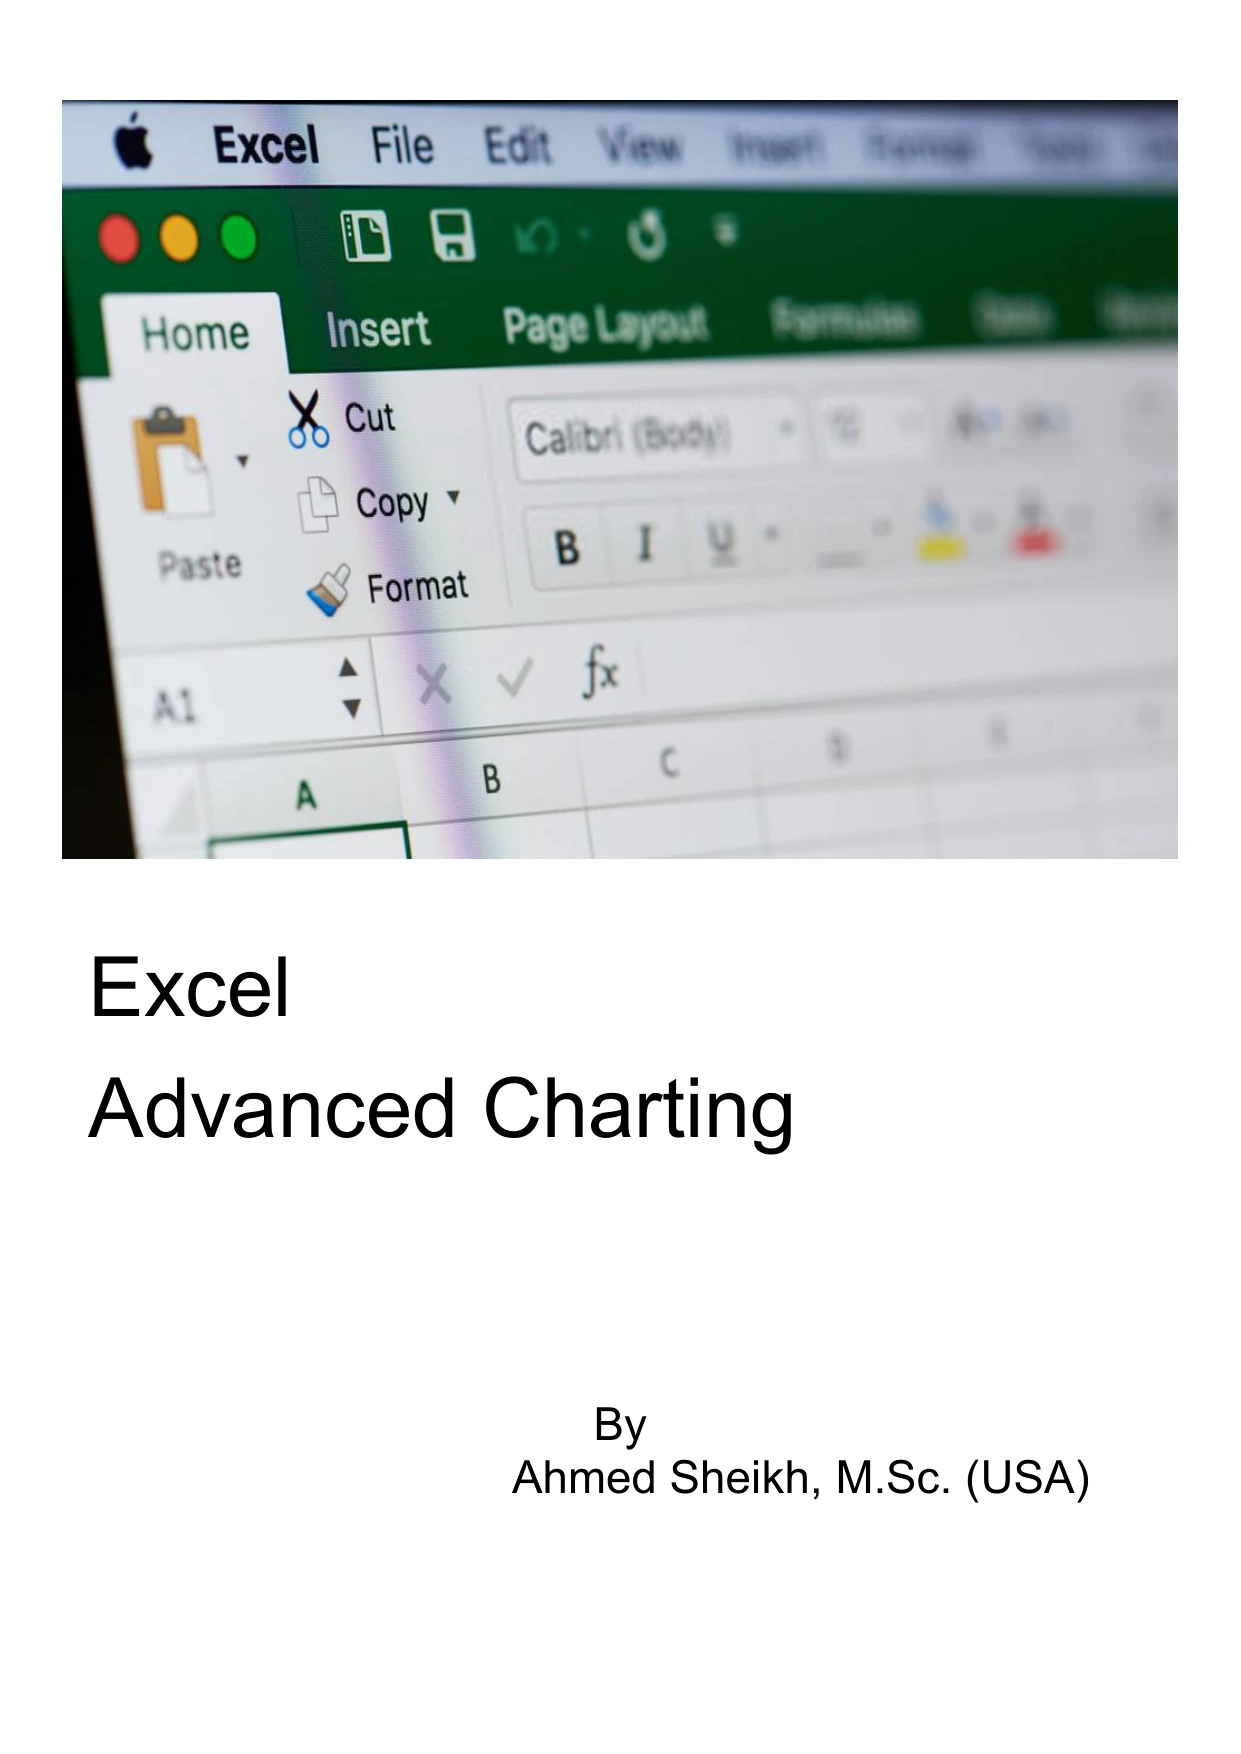
Excel Advanced Charting Step by Step
Original price was: $5.00.$2.50Current price is: $2.50.

Ahmed Sheikh
Product Specs:
- File Type: PDF
- File Size: 3.4 MB
- Book Language: English
- Total Page Count: 97
- Instant Download
Good spreadsheet charts take more than choosing a shape from a gallery. They depend on selecting the right data, arranging it clearly, and making thoughtful decisions about labels, scales, color, and emphasis. Ahmed Sheikh’s Excel Advanced Charting Step by Step walks through those practical choices, from building a chart from worksheet data to refining its individual elements.
From worksheet selection to a finished chart
The guidance starts with chart selection and data preparation, including how to chart both adjacent and separated ranges. It then covers chart layouts and themes, and explains how to work with titles, legends, data labels, axes, and gridlines. This stepwise approach connects the source data to the visual result rather than treating chart formatting as an isolated task.
Make the details work together
Readers will find instruction on formatting chart series and individual data points, adjusting plot areas, working with gradients and textures, and controlling 3-D rotation. The book also explores trendlines and forecasting, drop lines, up/down bars, and error bars—tools that can help communicate patterns or variation when they suit the data.
Explore more than standard chart types
Alongside familiar line and pie charts, the contents include waterfall charts, scatter-chart trendlines, SmartArt graphics and shapes, and sparklines. There is also guidance on copying charts, choosing whether they remain linked to a workbook, and saving and using chart templates.
A practical reference for Excel charting
This book is a useful fit for Excel users who already work with worksheet data and want hands-on guidance for creating, formatting, and managing charts. Keep it nearby when a chart needs more than a quick default—and when the right visual treatment can make a data point easier to understand.
User Reviews
Be the first to review “Excel Advanced Charting Step by Step”
You must be logged in to post a review.
Original price was: $5.00.$2.50Current price is: $2.50.

There are no reviews yet.